
Loop Data Box Score : Talladega Superspeedway
Sparks Energy 300
Talladega Superspeedway , Lincoln, AL
-
24

-
9

-
7

-
1

- Talladega Superspeedway
- 27th Annual Sparks Energy 300
- Pole Winner: Daniel Hemric
- Age: 27
- Team : No. 21 - South Point Hotel & Casino Chevrolet
- Owner: Richard Childress Racing
- Crew Chief: Danny Stockman, Jr
- Daniel Hemric won the Pole Award for the 27th Annual Sparks Energy 300 with a lap of 50.559 seconds, 189.402 mph.
- This is his third pole in 42 NASCAR XFINITY Series races.
- This is his second pole and eighth top-10 start in 2018.
- This is his first pole in two races at Talladega Superspeedway.
- Elliott Sadler (second) posted his fourth top-10 start of 2018 and his eighth in ten races at Talladega Superspeedway.
- Spencer Gallagher (third) posted his first top-10 start at Talladega Superspeedway. It is his third in nine races this season.
- Tyler Reddick (eighth) was the fastest qualifying rookie.
- Drivers Entered: 41 (3 drivers will not make the race)
- Laps Scheduled: 113
- Laps Actual: 115 - NASCAR OVERTIME!
- Margin of Victory: 0.152 Seconds
- Time of Race: 2 Hours 17 Minutes 44 Seconds
- Average Speed: 133.258
- Cautions: 5 for 29 laps
- Lead Changes: 12
- Green Flag Passes: 3,217 (37.4 passes per green flag lap)
- Talladega Superspeedway
- 27th Annual Sparks Energy 300
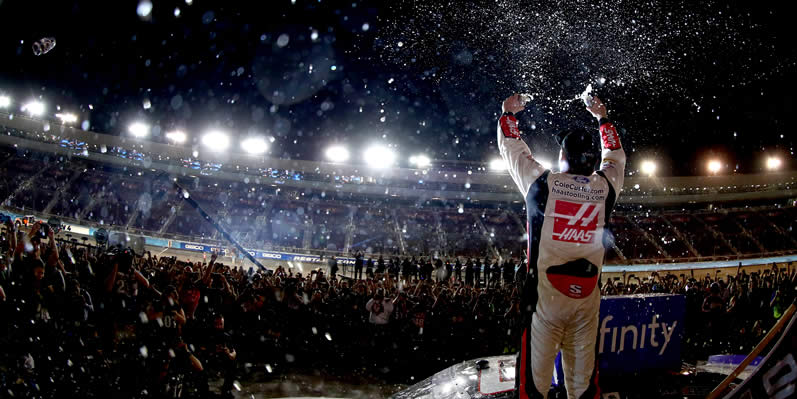
- Race Winner: Spencer Gallagher
- Age: 28
- Team : No. 23 - Allegiant Chevrolet
- Owner: GMS Racing
- Crew Chief: Chad Norris
- Spencer Gallagher won the 27th Annual Sparks Energy 300, his first victory in 49 NASCAR XFINITY Series races.
- This is his first victory and fifth top-10 finish in 2018.
- This is his first victory and first top-10 finish in two races at Talladega Superspeedway.
- Brandon Jones (second) posted his first top-10 finish in three races at Talladega Superspeedway. It is his fifth top-10 finish in 2018.
- Justin Allgaier (third) posted his sixth top-10 finish in eight races at Talladega Superspeedway.
- Tyler Reddick (eighth) was the highest finishing rookie.
- Elliott Sadler leads the point standings by 40 points over Tyler Reddick .
Want to know more about Loop Data?: I've put together a complete resource for NASCAR Loop Data insights and show how loop data can help you in fantasy, DFS and wagering.
| DRIVER | ST | MID | CLO | FIN | HI | LOW | ARP | PL DIF | GFP | GFxP | PD | QPS | % QPS | FST | % T15 | LED | % LED | LAPS | DR | TOT PTS |
|---|---|---|---|---|---|---|---|---|---|---|---|---|---|---|---|---|---|---|---|---|
| Spencer Gallagher | 3 | 16 | 10 | 1 | 1 | 29 | 9.6 | 2 | 110 | 103 | 7 | 81 | 73.64 | 5 | 90.4 | 1 | 0.9 | 115 | 110.20 | 49 |
| Brandon Jones | 15 | 11 | 7 | 2 | 2 | 22 | 10.1 | 13 | 131 | 122 | 9 | 91 | 69.47 | 4 | 88.7 | 0 | 0.0 | 115 | 101.10 | 42 |
| Justin Allgaier | 6 | 5 | 1 | 3 | 1 | 28 | 5.9 | 3 | 89 | 63 | 26 | 52 | 58.43 | 11 | 90.4 | 35 | 30.4 | 115 | 128.80 | 46 |
| Noah Gragson | 20 | 9 | 11 | 4 | 3 | 30 | 15.7 | 16 | 99 | 103 | -4 | 43 | 43.43 | 1 | 34.8 | 0 | 0.0 | 115 | 81.90 | 0 |
| Elliott Sadler | 2 | 1 | 22 | 5 | 1 | 34 | 10.8 | -3 | 72 | 58 | 14 | 38 | 52.78 | 3 | 67.0 | 30 | 26.1 | 115 | 118.00 | 45 |
| Ryan Sieg | 22 | 29 | 21 | 6 | 1 | 40 | 24.9 | 16 | 95 | 66 | 29 | 17 | 17.89 | 0 | 7.8 | 1 | 0.9 | 115 | 57.70 | 31 |
| John Hunter Nemechek | 4 | 6 | 14 | 7 | 2 | 31 | 11.3 | -3 | 76 | 74 | 2 | 51 | 67.11 | 4 | 75.7 | 0 | 0.0 | 115 | 90.80 | 37 |
| Tyler Reddick | 8 | 13 | 5 | 8 | 1 | 31 | 8.6 | 0 | 129 | 104 | 25 | 84 | 65.12 | 4 | 88.7 | 2 | 1.7 | 115 | 105.10 | 36 |
| Cole Custer | 12 | 3 | 9 | 9 | 2 | 28 | 11.2 | 3 | 113 | 117 | -4 | 77 | 68.14 | 3 | 87.8 | 0 | 0.0 | 115 | 94.70 | 36 |
| Garrett Smithley | 34 | 19 | 3 | 10 | 3 | 34 | 17.0 | 24 | 69 | 52 | 17 | 12 | 17.39 | 1 | 36.5 | 0 | 0.0 | 115 | 78.70 | 27 |
| JJ Yeley | 27 | 30 | 18 | 11 | 3 | 40 | 25.2 | 16 | 87 | 79 | 8 | 17 | 19.54 | 0 | 13.0 | 0 | 0.0 | 115 | 55.00 | 26 |
| Christopher Bell | 13 | 2 | 8 | 12 | 1 | 38 | 12.6 | 1 | 96 | 112 | -16 | 59 | 61.46 | 9 | 77.4 | 1 | 0.9 | 115 | 96.20 | 25 |
| Jeff Green | 35 | 24 | 17 | 13 | 1 | 39 | 22.2 | 22 | 101 | 74 | 27 | 22 | 21.78 | 2 | 16.5 | 1 | 0.9 | 115 | 62.70 | 24 |
| Michael Annett | 5 | 7 | 13 | 14 | 2 | 33 | 11.5 | -9 | 87 | 95 | -8 | 63 | 72.41 | 8 | 77.4 | 0 | 0.0 | 115 | 90.40 | 30 |
| Shane Lee | 7 | 15 | 12 | 15 | 6 | 32 | 14.4 | -8 | 103 | 107 | -4 | 64 | 62.14 | 4 | 62.6 | 0 | 0.0 | 115 | 85.20 | 24 |
| Chase Briscoe | 16 | 14 | 20 | 16 | 2 | 30 | 19.6 | 0 | 107 | 134 | -27 | 60 | 56.07 | 1 | 32.2 | 0 | 0.0 | 115 | 68.10 | 21 |
| Vinnie Miller | 25 | 25 | 4 | 17 | 4 | 36 | 21.1 | 8 | 62 | 50 | 12 | 7 | 11.29 | 3 | 31.3 | 0 | 0.0 | 115 | 65.40 | 20 |
| Tommy Joe Martins | 28 | 32 | 16 | 18 | 3 | 33 | 22.4 | 10 | 61 | 54 | 7 | 6 | 9.84 | 0 | 25.2 | 0 | 0.0 | 115 | 58.70 | 19 |
| BJ McLeod | 29 | 31 | 15 | 19 | 4 | 36 | 22.7 | 10 | 59 | 50 | 9 | 7 | 11.86 | 0 | 27.0 | 0 | 0.0 | 115 | 58.00 | 18 |
| Kaz Grala | 33 | 17 | 24 | 20 | 7 | 37 | 23.6 | 13 | 96 | 89 | 7 | 7 | 7.29 | 0 | 4.4 | 0 | 0.0 | 114 | 55.80 | 17 |
| Joey Gase | 18 | 18 | 27 | 21 | 8 | 33 | 19.8 | -3 | 111 | 99 | 12 | 33 | 29.73 | 4 | 31.3 | 0 | 0.0 | 114 | 68.60 | 18 |
| Ryan Reed | 19 | 4 | 23 | 22 | 1 | 34 | 15.0 | -3 | 107 | 109 | -2 | 53 | 49.53 | 1 | 58.3 | 1 | 0.9 | 114 | 79.50 | 23 |
| Daniel Hemric | 1 | 8 | 6 | 23 | 1 | 30 | 8.1 | -22 | 77 | 89 | -12 | 48 | 62.34 | 4 | 87.0 | 39 | 34.2 | 114 | 104.50 | 24 |
| Alex Labbe | 21 | 20 | 28 | 24 | 5 | 33 | 20.6 | -3 | 122 | 129 | -7 | 58 | 47.54 | 0 | 24.4 | 0 | 0.0 | 114 | 67.00 | 13 |
| Matt Tifft | 10 | 10 | 31 | 25 | 4 | 31 | 12.5 | -15 | 111 | 130 | -19 | 84 | 75.68 | 0 | 77.4 | 0 | 0.0 | 114 | 86.80 | 22 |
| Josh Williams | 31 | 21 | 29 | 26 | 3 | 31 | 22.1 | 5 | 113 | 117 | -4 | 21 | 18.58 | 3 | 11.3 | 0 | 0.0 | 114 | 59.80 | 11 |
| Timmy Hill | 38 | 27 | 26 | 27 | 4 | 38 | 24.8 | 11 | 71 | 93 | -22 | 12 | 16.90 | 1 | 20.0 | 0 | 0.0 | 114 | 44.80 | 10 |
| Josh Bilicki | 32 | 34 | 25 | 28 | 7 | 37 | 26.8 | 4 | 60 | 55 | 5 | 9 | 15.00 | 0 | 16.5 | 0 | 0.0 | 114 | 41.80 | 9 |
| Jennifer Jo Cobb | 39 | 26 | 30 | 29 | 9 | 40 | 31.5 | 10 | 60 | 84 | -24 | 7 | 11.67 | 0 | 5.2 | 0 | 0.0 | 114 | 37.20 | 0 |
| Austin Cindric | 11 | 12 | 2 | 30 | 1 | 34 | 11.8 | -19 | 123 | 119 | 4 | 57 | 46.34 | 3 | 67.0 | 3 | 2.6 | 114 | 80.00 | 7 |
| Joe Nemechek | 23 | 23 | 19 | 31 | 9 | 31 | 20.6 | -8 | 89 | 97 | -8 | 10 | 11.24 | 1 | 8.7 | 0 | 0.0 | 113 | 58.00 | 0 |
| David Starr | 37 | 28 | 32 | 32 | 8 | 37 | 29.1 | 5 | 61 | 89 | -28 | 6 | 9.84 | 0 | 2.6 | 0 | 0.0 | 112 | 35.80 | 5 |
| Mike Harmon | 40 | 33 | 33 | 33 | 1 | 40 | 31.9 | 7 | 44 | 47 | -3 | 2 | 4.55 | 0 | 2.6 | 1 | 0.9 | 112 | 31.20 | 4 |
| Ross Chastain | 26 | 22 | 34 | 34 | 7 | 34 | 26.4 | -8 | 60 | 66 | -6 | 6 | 10.00 | 0 | 0.9 | 0 | 0.0 | 78 | 53.30 | 3 |
| Jeremy Clements | 24 | 35 | 35 | 35 | 6 | 40 | 33.2 | -11 | 39 | 67 | -28 | 20 | 51.28 | 0 | 4.4 | 0 | 0.0 | 53 | 26.00 | 2 |
| Dylan Lupton | 17 | 36 | 36 | 36 | 15 | 28 | 32.1 | -19 | 27 | 31 | -4 | 1 | 3.70 | 0 | 0.0 | 0 | 0.0 | 32 | 45.30 | 1 |
| Ty Majeski | 14 | 37 | 37 | 37 | 5 | 19 | 29.6 | -23 | 32 | 36 | -4 | 26 | 81.25 | 2 | 22.6 | 0 | 0.0 | 32 | 55.10 | 1 |
| Ryan Truex | 9 | 38 | 38 | 38 | 3 | 31 | 27.5 | -29 | 42 | 25 | 17 | 23 | 54.76 | 1 | 24.4 | 0 | 0.0 | 32 | 72.90 | 9 |
| Chad Finchum | 36 | 39 | 39 | 39 | 21 | 36 | 35.7 | -3 | 14 | 14 | 0 | 0 | 0.00 | 0 | 0.0 | 0 | 0.0 | 32 | 26.30 | 1 |
| Spencer Boyd | 30 | 40 | 40 | 40 | 13 | 34 | 35.1 | -10 | 12 | 16 | -4 | 0 | 0.00 | 1 | 0.9 | 0 | 0.0 | 32 | 33.90 | 1 |