How Accupredict Odds are calculated
By Cliff DeJong
Accupredict, as currently configured, will calculate each NASCAR driver's Predicted Finish, and then Rank the drivers. A more common expression of a driver's expected performance is the odds for a driver to win (or be in the Top-5 or Top-10). Odds are calculated from the probabilities of the event in question. Probabilities are estimated by the frequency of an event.
The probabilities can be estimated from the Accupredict database which includes races from 2012 through early 2022. There are 365 races with an average of almost 40 drivers per race in the data.
There are 46 winners among the 659 drivers with Predicted Finishes between 11 and 12; the probability of winning is 46/659, or 7%.
Probability of Winning Based on Predicted Finish
The following chart (CHART 1) shows probability of winning as a function of Predicted Finish. Data for Top-5 and Top-10 finishes are also shown.
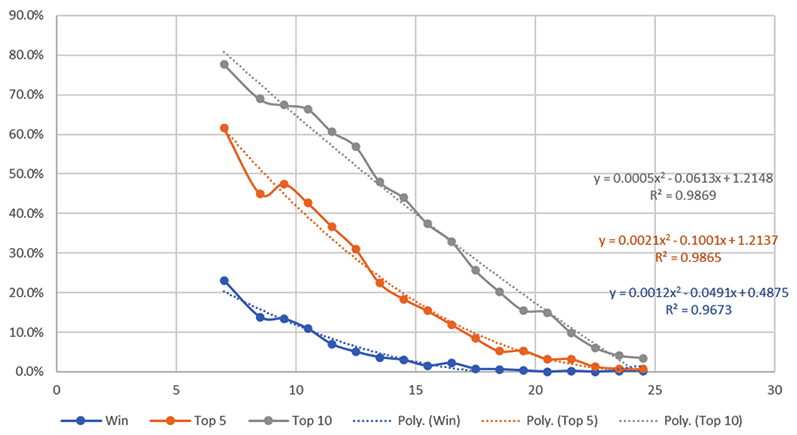
The blue curve shows the probability of winning is about 20% for the best Predicted Finishes, falling to about 2% for a Predicted Finish of 15. The equation in blue is the least squares fit to the data. A second degree polynomial was picked as the best fit among simple equations.
The orange curve shows the probability of a finish in the Top-5, with the curve fit shown also in orange. Top-10 probabilities and the curve fit are in gray.
It is interesting that a driver with a Predicted Finish of '10.0'...finishes in the Top-10 almost 70% of the time.
Odds are related to probability. For a driver with a Predicted Finish of 7, it is estimated that the probability of winning is 20.2%. This is equivalent to odds of +394, or fractional odds of 3.94 to 1.
Probability of Winning Based on Predicted Finish Ranked
A similar calculation (CHART 2) was done for the Accupredict Rank, determined by ranking the Predicted Finishes in order.
There is more 'scatter' in the probability of winning versus Rank, and the curve fits are not as good. Note that the best probability of winning is 18% for Rank 1 drivers.
An interesting observation, not shown on the chart, is that 60% of drivers ranked in the Top-10 actually finished in the Top-10.
The following table (TABLE 1) shows winning probabilities for a combination of Rank and Predicted Finish, with Rank along the top, and Predicted Finish ranges on the left.
| RANK | ||||||||||||||||
|---|---|---|---|---|---|---|---|---|---|---|---|---|---|---|---|---|
| 1 | 2 | 3 | 4 | 5 | 6 | 7 | 8 | 9 | 10 | 11 | 12 | 13 | 14 | 15 | ||
| 6-7 | 20.0% | |||||||||||||||
| 7-8 | 22.1% | 30.4% | 0.0% | |||||||||||||
| 8-9 | 18.9% | 9.4% | 6.9% | 0.0% | ||||||||||||
| 9-10 | 14.4% | 12.5% | 17.4% | 10.8% | 3.6% | 0.0% | ||||||||||
| PRD FIN | 10-11 | 14.3% | 10.8% | 16.4% | 7.4% | 3.8% | 16.9% | 12.0% | 0.0% | |||||||
| 11-12 | 0.0% | 7.7% | 17.6% | 7.9% | 5.6% | 8.2% | 2.8% | 1.9% | 5.3% | 0.0% | ||||||
| 12-13 | 0.0% | 10.0% | 7.1% | 4.3% | 4.5% | 8.1% | 7.7% | 1.6% | 0.0% | |||||||
| 13-14 | 0.0% | 17.6% | 3.2% | 3.1% | 4.0% | 2.6% | 3.4% | 4.2% | 1.4% | 8.0% | 0.0% | |||||
| 14-15 | 0.0% | 7.1% | 2.0% | 2.7% | 3.1% | 3.6% | 3.5% | 0.0% | ||||||||
| 15-16 | 0.0% | 2.8% | 4.3% | 3.6% | 0.8% | 0.6% | 1.4% | |||||||||
TABLE 1: Winning probabilities for a combination of Rank and Predicted Finish
Upon reflection, it is difficult to draw any conclusions from this because some entries have a very small number of observations. For example, the 30.4% entry for Rank 2, Predicted Finishes between 7 and 8, is only 23 data points, with 7 winners. More typically, there are over 100 observations for each cell of data.
In the following table (TABLE 2), the percentage of winning drivers observed for each Rank and the curve fit are shown above the Ranks in yellow. Similar data are shown alongside the Predicted Finishes in yellow. An example is that for Rank 6, 7.9% of the drivers won the race, while the curve fit estimates 6.9%. Similarly, drivers with Predicted Finishes between 10 and 11 were winners 10.9% of the time, while the curve fit estimates 10.4% will win.
| RANK OBS | 17.6% | 12.1% | 15.7% | 8.0% | 5.5% | 7.9% | 5.5% | 5.5% | 2.5% | 2.8% | 4.1% | 3.3% | 2.5% | 60.0% | 1.7% | ||
|---|---|---|---|---|---|---|---|---|---|---|---|---|---|---|---|---|---|
| RANK FIT | 17.5% | 13.4% | 11.0% | 9.3% | 8.0% | 6.9% | 6.0% | 5.2% | 4.5% | 3.9% | 3.4% | 2.8% | 2.4% | 1.9% | 1.5% | ||
| PF OBS | PF FIT | 1 | 2 | 3 | 4 | 5 | 6 | 7 | 8 | 9 | 10 | 11 | 12 | 13 | 14 | 15 | |
| 19.0% | 20.9% | 6-7 | 20.0% | ||||||||||||||
| 23.6% | 18.7% | 7-8 | 22.1% | 30.4% | 0.0% | ||||||||||||
| 13.9% | 15.7% | 8-9 | 18.9% | 9.4% | 6.9% | 0.0% | |||||||||||
| 13.3% | 12.9% | 9-10 | 14.4% | 12.5% | 17.4% | 10.8% | 3.6% | 0.0% | |||||||||
| 10.9% | 10.4% | 10-11 | 14.3% | 10.8% | 16.4% | 7.4% | 3.8% | 16.9% | 12.0% | 0.0% | |||||||
| 7.0% | 8.2% | 11-12 | 0.0% | 7.7% | 17.6% | 7.9% | 5.6% | 8.2% | 2.8% | 1.9% | 5.3% | 0.0% | |||||
| 5.0% | 6.1% | 12-13 | 0.0% | 10.0% | 7.1% | 4.3% | 4.5% | 8.1% | 7.7% | 1.6% | 0.0% | ||||||
| 3.6% | 4.3% | 13-14 | 0.0% | 17.6% | 3.2% | 3.1% | 4.0% | 2.6% | 3.4% | 4.2% | 1.4% | 8.0% | 0.0% | ||||
| 2.9% | 2.8% | 14-15 | 0.0% | 7.1% | 2.0% | 2.7% | 3.1% | 3.6% | 3.5% | 0.0% | |||||||
| 1.5% | 1.5% | 15-16 | 0.0% | 2.8% | 4.3% | 3.6% | 0.8% | 0.6% | 1.4% |
TABLE 2: Percentage of Winning Drivers Observed and Curve Fit for both Rank and Predicted Finish
An attempt was made to fit both Rank and Predicted Finish to observed probabilities of winning, and it was decided that this would need to be adjusted by the number of observations at each point. While that is straightforward, but time-consuming, it was not done at this time.
It is my judgement from TABLE 2 that the best fit seems to be to the Predicted Finish:
The Probability of Winning Calculation
Prob of Winning = 0.4875 – 0.0491 * PF + 0.0012 * PF^2
As an example, PF = 8 gives 17.2%.
The equations in CHART 1 can be used to estimate the probabilities of Top-5 or Top-10 finishes as a function of the Predicted Finish. If a calculation produces a probability of less than 0, then it should be limited to zero.
Converting a non-zero probability P expressed in percent to odds is straightforward.
Fractional odds are 1/(P/100) – 1. For 20% probability, fractional odds are 1/(20/100) – 1, or 4 to 1.
For positive odds, calculate 100/(P/100) – 100. For 20%, 1/(20/100) or 400. Positive odds will be 100 times the fractional odds.
Negative odds, for the favorites or greater than 50% probability, are calculated as P/(1-(P/100)), expressed as a negative number. For 60%, 60/(1-(60/100)) is -150.
Additional Tools and Information
Links to sites with additional reading and help on sports betting odds.
- Action Network - Betting Odds Calculator
- AceOdds - Odds Converter
- Gambling Sites - Why Odds and Lines Change
- AQHA - The Morning Line