Loop Data Box Score : Las Vegas Motor Speedway
Pennzoil 400
Las Vegas Motor Speedway , Las Vegas, NV
-
16

-
14

-
6

- Las Vegas Motor Speedway
- Pennzoil 400 presented by Jiffy Lube
- Busch Pole Award Pole Winner: Joey Logano
- Age: 32
- Team : No. 22 - Pennzoil Ford
- Owner: Roger Penske
- Crew Chief: Paul Wolfe
- Joey Logano won the Pole Award for the Pennzoil 400 presented by Jiffy Lube with a lap of 29.024 seconds, 186.053 mph.
- This is his 27th pole in 510 NASCAR Cup Series races.
- This is his first pole and third top-10 start in 2023.
- This is his second pole in 20 races at Las Vegas Motor Speedway.
- William Byron (second) posted his first top-10 start of 2023 and his fourth in 11 races at Las Vegas Motor Speedway.
- Ryan Blaney (third) posted his seventh top-10 start at Las Vegas Motor Speedway. It is his third in three races this season.
- Ty Gibbs (fourth) was the fastest qualifying rookie.
- Sunday, March 5th, 2023
- NASCAR Wire Service - Reid Spencer
William Byron leads 1-2-3 Hendrick Motorsports sweep at Las Vegas
William Byron won the most important race of Sunday afternoon—by inches off pit road.
Quick work by Byron's pit crew enabled the driver of the No. 24 Hendrick Motorsports Chevrolet to beat teammate Kyle Larson off pit road for an overtime restart in the Pennzoil 400 at Las Vegas Motor Speedway, and that was the decisive factor in Byron's fifth career NASCAR Cup Series victory.
When Aric Almirola spun into the Turn 4 wall with four laps left of a scheduled 267, the race turned upside down. Larson held a two-second lead at that point and appeared the almost certain winner.
After NASCAR called the fourth and final caution, Martin Truex Jr. stayed on the track, with Byron, Larson and most of the other contenders pitting for two tires. Byron's crew was a fraction of a second faster on the stop, and Byron claimed a front-row starting spot for the overtime to Truex's outside.
On the first overtime lap, Byron surged past Truex as the cars entered Turn 3 at the 1.5-mile track and pulled away to win by.622 seconds over Larson and by .766 seconds over teammate Alex Bowman. It was the third time Hendrick Motorsports had finished 1-2-3 in a Cup Series event.
The drivers accomplished the feat with their fourth driver, Chase Elliott, watching from North Carolina with team owner Rick Hendrick. Elliott broke his left tibia in a snowboarding accident in Colorado on Friday and will miss multiple races as he recovers from surgery.
Josh Berry, substituting for Elliott, finished 29th, two laps down, in his first race in NASCAR's Next Gen car.
"Yeah, just been really confident about the group of guys that I have on this 24 team," said Byron, who led 176 of 271 laps, swept the first two stages and won for the first time at Las Vegas. "They work extremely hard, and we spent a lot of time in the offseason just going through running at the sim (simulator) with Chevy and running on iRacing and just trying to get better as a race car driver and as a team.
"Thinking of Chase back home. Wish he was out here with us. He's a great race car driver, great teammate. Wish he was out here."
For the overtime restart, Larson chose the inside lane behind Truex and was bottled up behind the No. 19 Toyota. But Larson acknowledged the race was lost on pit road.
"Damn," Larson said with a wry laugh. "It's just part of Cup racing. It seems like kind of laps down, lap by lap, and then, sure enough, the yellow lights come on. You've just got to get over that and then try to execute a good pit stop, and I thought I did a really good job getting to my sign, and getting to the commitment line.
"I had a gap to William behind me, and their pit crew must have just done a really good job and got out in front of us, and that gave up the front row. I knew I was in trouble with the 19 staying out. I felt like William was going to get by him.
"Yeah, just a bummer that we didn't end up the winner, but all in all, William probably had a little bit better car than I had today, and their pit crew executed when they needed to there at the end."
In the overtime scramble, Bubba Wallace finished fourth and Christopher Bell fifth, both in Toyotas. Austin Cindric, who had been lapped at one point, recovered to run sixth as the top-finishing Ford driver. Truex, Justin Haley, Kevin Harvick and Daniel Suarez completed the top 10.
In a race that featured 13 lead changes among eight drivers, Larson took the top spot in Lap 196, after restarting third behind Denny Hamlin and Bowman on lap 190. The 2021 series champion extended his advantage to nearly five seconds over Byron during an exchange of green-flag pit stops before Almirola's accident caused the fourth caution on Lap 263.
Byron had cut Larson's lead to two seconds before the accident forced overtime.
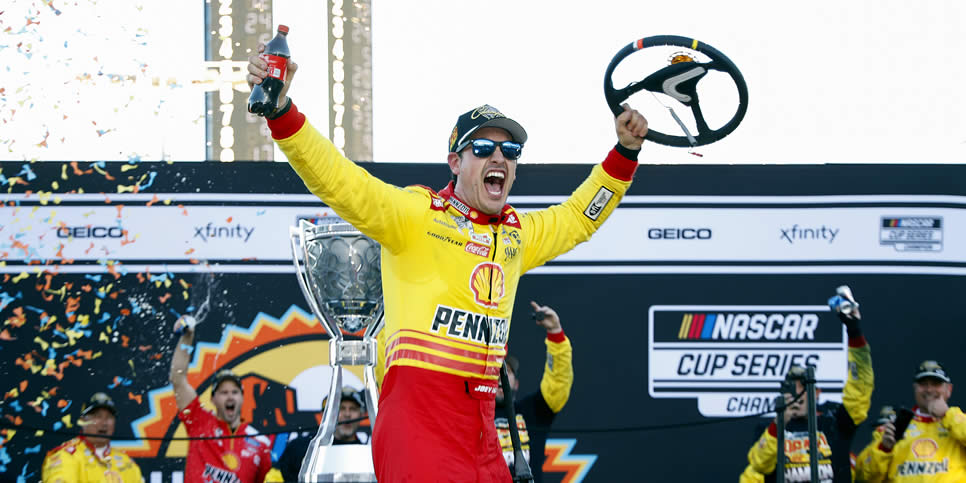
The first caution for an on-track incident didn't occur until Lap 183, nine laps after the final stage went green. Pole winner Joey Logano, Brad Keselowski and Kyle Busch were running three-wide through Turn 4 when disaster struck.
With Keselowski's No. 6 Ford in the middle, Logano ran out of room to the outside, and after contact with Keselowski's car, Logano's No. 22 Ford bounced off the wall and spun into the infield grass.
Logano brought his car to pit road, but his crew couldn't repair the Ford before the seven-minute time limit ran out under NASCAR's damaged vehicle policy.
Asked whether Keselowski pinched him into the corner, Logano replied, "Yeah, he did. I'm sure he didn't mean to do it. It is what it is. What are you going to do, right? We got fenced."
- Drivers Entered: 36
- Laps Scheduled: 267
- Laps Actual: 271 - NASCAR OVERTIME!
- Margin of Victory: 0.622 Seconds
- Time of Race: 2 Hours 50 Minutes 35 Seconds
- Average Speed: 142.980
- Cautions: 4 for 26 laps
- Lead Changes: 13
- Green Flag Passes: 3,648 (14.9 passes per green flag lap)
- Las Vegas Motor Speedway
- Pennzoil 400 presented by Jiffy Lube
- Race Winner: William Byron
- Age: 25
- Team : No. 24 - RaptorTough.com Chevrolet
- Owner: Rick Hendrick
- Crew Chief: Rudy Fugle
- William Byron won the Pennzoil 400 presented by Jiffy Lube, his fifth victory in 183 Cup Series races.
- This is his first victory and first top-10 finish in 2023.
- This is his first victory and fourth top-10 finish in 11 races at Las Vegas Motor Speedway.
- Kyle Larson (second) posted his 10th top-10 finish in 14 races at Las Vegas Motor Speedway. It is his first top-10 finish in 2023.
- Alex Bowman (third) posted his fourth top-10 finish in 12 races at Las Vegas Motor Speedway.
- Ty Gibbs (22nd) was the highest finishing rookie.
- William Byron leads the point standings by 7 points over Kyle Larson.
| DRIVER | ST | MID | CLO | FIN | HI | LOW | ARP | PL DIF | GFP | GFxP | PD | QPS | % QPS | FST | % T15 | LED | % LED | LAPS | DR | TOT PTS |
|---|---|---|---|---|---|---|---|---|---|---|---|---|---|---|---|---|---|---|---|---|
| William Byron | 2 | 1 | 2 | 1 | 1 | 11 | 1.7 | 1 | 50 | 46 | 4 | 38 | 76.00 | 59 | 100.0 | 176 | 64.9 | 271 | 148.20 | 60 |
| Kyle Larson | 6 | 2 | 1 | 2 | 1 | 17 | 2.2 | 4 | 62 | 56 | 6 | 45 | 72.58 | 40 | 99.3 | 63 | 23.3 | 271 | 126.30 | 53 |
| Alex Bowman | 11 | 4 | 4 | 3 | 1 | 19 | 6.2 | 8 | 87 | 79 | 8 | 66 | 75.86 | 28 | 98.2 | 2 | 0.7 | 271 | 110.50 | 46 |
| Bubba Wallace | 13 | 6 | 8 | 4 | 2 | 18 | 7.8 | 9 | 131 | 117 | 14 | 100 | 76.34 | 9 | 99.6 | 0 | 0.0 | 271 | 101.60 | 41 |
| Christopher Bell | 10 | 3 | 12 | 5 | 3 | 24 | 8.1 | 5 | 122 | 116 | 6 | 72 | 59.02 | 5 | 86.7 | 0 | 0.0 | 271 | 101.00 | 45 |
| Austin Cindric | 9 | 23 | 15 | 6 | 5 | 34 | 18.3 | 3 | 102 | 103 | -1 | 23 | 22.55 | 1 | 30.3 | 0 | 0.0 | 271 | 75.90 | 31 |
| Martin Truex Jr | 15 | 7 | 5 | 7 | 1 | 35 | 6.7 | 8 | 152 | 146 | 6 | 84 | 55.26 | 6 | 96.7 | 3 | 1.1 | 271 | 105.60 | 42 |
| Justin Haley | 27 | 19 | 19 | 8 | 4 | 29 | 19.0 | 19 | 172 | 154 | 18 | 26 | 15.12 | 6 | 7.4 | 0 | 0.0 | 271 | 72.10 | 29 |
| Kevin Harvick | 14 | 11 | 7 | 9 | 6 | 28 | 10.9 | 5 | 120 | 118 | 2 | 76 | 63.33 | 1 | 95.9 | 0 | 0.0 | 271 | 87.90 | 29 |
| Daniel Suarez | 24 | 13 | 11 | 10 | 4 | 24 | 13.6 | 14 | 135 | 128 | 7 | 74 | 54.81 | 7 | 63.5 | 0 | 0.0 | 271 | 81.80 | 27 |
| Denny Hamlin | 12 | 10 | 3 | 11 | 1 | 30 | 6.2 | 1 | 145 | 151 | -6 | 91 | 62.76 | 11 | 97.1 | 10 | 3.7 | 271 | 105.20 | 35 |
| Ross Chastain | 8 | 5 | 6 | 12 | 3 | 15 | 5.4 | -4 | 80 | 87 | -7 | 53 | 66.25 | 6 | 99.6 | 0 | 0.0 | 271 | 103.10 | 37 |
| Ryan Blaney | 3 | 18 | 9 | 13 | 2 | 36 | 12.7 | -10 | 131 | 139 | -8 | 61 | 46.56 | 7 | 71.2 | 0 | 0.0 | 271 | 80.70 | 24 |
| Kyle Busch | 5 | 9 | 10 | 14 | 4 | 21 | 10.8 | -9 | 123 | 130 | -7 | 76 | 61.79 | 2 | 92.3 | 0 | 0.0 | 271 | 86.60 | 25 |
| Tyler Reddick | 34 | 15 | 13 | 15 | 1 | 34 | 13.4 | 19 | 149 | 115 | 34 | 75 | 50.34 | 6 | 83.4 | 3 | 1.1 | 271 | 81.10 | 22 |
| Aric Almirola | 21 | 16 | 17 | 16 | 7 | 31 | 17.6 | 5 | 128 | 132 | -4 | 30 | 23.44 | 1 | 25.8 | 0 | 0.0 | 271 | 71.20 | 21 |
| Brad Keselowski | 7 | 8 | 18 | 17 | 1 | 21 | 10.7 | -10 | 117 | 122 | -5 | 72 | 61.54 | 4 | 83.4 | 5 | 1.9 | 271 | 80.60 | 23 |
| AJ Allmendinger | 23 | 20 | 14 | 18 | 5 | 34 | 19.0 | 5 | 143 | 140 | 3 | 31 | 21.68 | 1 | 21.8 | 0 | 0.0 | 271 | 63.90 | 19 |
| Erik Jones | 22 | 12 | 16 | 19 | 5 | 24 | 14.7 | 3 | 123 | 113 | 10 | 45 | 36.59 | 1 | 56.1 | 0 | 0.0 | 270 | 67.60 | 18 |
| Corey Lajoie | 19 | 21 | 21 | 20 | 8 | 27 | 20.0 | -1 | 102 | 109 | -7 | 3 | 2.94 | 0 | 3.7 | 0 | 0.0 | 270 | 56.20 | 17 |
| Chris Buescher | 18 | 17 | 22 | 21 | 11 | 30 | 19.8 | -3 | 123 | 124 | -1 | 13 | 10.57 | 9 | 7.4 | 0 | 0.0 | 270 | 59.70 | 16 |
| Ty Gibbs | 4 | 25 | 20 | 22 | 4 | 33 | 24.0 | -18 | 101 | 122 | -21 | 6 | 5.94 | 5 | 4.4 | 0 | 0.0 | 270 | 57.50 | 15 |
| Ryan Preece | 31 | 22 | 23 | 23 | 4 | 35 | 23.4 | 8 | 93 | 84 | 9 | 7 | 7.53 | 0 | 2.2 | 0 | 0.0 | 270 | 47.00 | 14 |
| Ricky Stenhouse Jr | 16 | 28 | 24 | 24 | 11 | 32 | 25.1 | -8 | 98 | 103 | -5 | 3 | 3.06 | 2 | 1.5 | 0 | 0.0 | 270 | 51.50 | 13 |
| Michael McDowell | 17 | 24 | 25 | 25 | 8 | 34 | 24.4 | -8 | 99 | 112 | -13 | 11 | 11.11 | 11 | 3.3 | 0 | 0.0 | 270 | 53.60 | 12 |
| Harrison Burton | 35 | 30 | 29 | 26 | 19 | 36 | 28.8 | 9 | 83 | 75 | 8 | 0 | 0.00 | 2 | 0.0 | 0 | 0.0 | 269 | 39.30 | 11 |
| Austin Dillon | 26 | 27 | 26 | 27 | 7 | 32 | 26.8 | -1 | 110 | 108 | 2 | 5 | 4.55 | 0 | 1.1 | 0 | 0.0 | 269 | 43.00 | 10 |
| Chase Briscoe | 20 | 31 | 28 | 28 | 14 | 32 | 26.4 | -8 | 91 | 106 | -15 | 0 | 0.00 | 0 | 0.0 | 0 | 0.0 | 269 | 43.30 | 9 |
| Josh Berry | 32 | 26 | 27 | 29 | 3 | 33 | 27.3 | 3 | 93 | 91 | 2 | 6 | 6.45 | 0 | 1.1 | 0 | 0.0 | 269 | 41.70 | 0 |
| Noah Gragson | 25 | 29 | 30 | 30 | 21 | 36 | 30.2 | -5 | 70 | 80 | -10 | 0 | 0.00 | 6 | 0.0 | 0 | 0.0 | 269 | 37.30 | 7 |
| Todd Gilliland | 28 | 32 | 31 | 31 | 26 | 36 | 31.0 | -3 | 49 | 51 | -2 | 0 | 0.00 | 2 | 0.0 | 0 | 0.0 | 268 | 33.60 | 6 |
| BJ McLeod | 36 | 33 | 32 | 32 | 3 | 36 | 33.0 | 4 | 62 | 58 | 4 | 8 | 12.90 | 0 | 1.5 | 0 | 0.0 | 266 | 27.20 | 5 |
| JJ Yeley | 29 | 35 | 34 | 33 | 2 | 35 | 33.0 | -4 | 56 | 60 | -4 | 8 | 14.29 | 0 | 1.1 | 0 | 0.0 | 265 | 28.50 | 4 |
| Ty Dillon | 33 | 34 | 33 | 34 | 14 | 36 | 33.0 | -1 | 57 | 60 | -3 | 2 | 3.51 | 1 | 0.0 | 0 | 0.0 | 265 | 29.60 | 3 |
| Cody Ware | 30 | 36 | 35 | 35 | 26 | 36 | 35.6 | -5 | 20 | 26 | -6 | 0 | 0.00 | 0 | 0.0 | 0 | 0.0 | 259 | 23.70 | 2 |
| Joey Logano | 1 | 14 | 36 | 36 | 1 | 26 | 19.5 | -35 | 69 | 86 | -17 | 39 | 56.52 | 1 | 64.6 | 9 | 4.9 | 183 | 66.10 | 1 |