
Loop Data Box Score : Phoenix Raceway
NASCAR Xfinity Series Championship
Phoenix Raceway , Phoenix, AZ
-
26

-
6

-
4

- Phoenix Raceway
- 23rd Annual NASCAR Xfinity Series Championship Race
- Pole Winner: Austin Cindric
- Age: 23
- Team : No. 22 - CarShop Ford
- Owner: Team Penske
- Crew Chief: Brian Wilson
- Austin Cindric won the Pole Award for the 23rd Annual NASCAR Xfinity Series Championship Race with a lap of 27.293 seconds, 131.902 mph.
- This is his eighth pole in 133 NASCAR Xfinity Series races.
- This is his first pole and 29th top-10 start in 2021.
- This is his first pole in eight races at Phoenix Raceway.
- John Hunter Nemechek (second) posted his second top-10 start of 2021 and his second in four races at Phoenix Raceway.
- Justin Allgaier (third) posted his 15th top-10 start at Phoenix Raceway. It is his 25th in 33 races this season.
- Sam Mayer (11th) was the fastest qualifying rookie.
- Saturday, November 6th, 2021
- NASCAR Wire Service - Reid Spencer
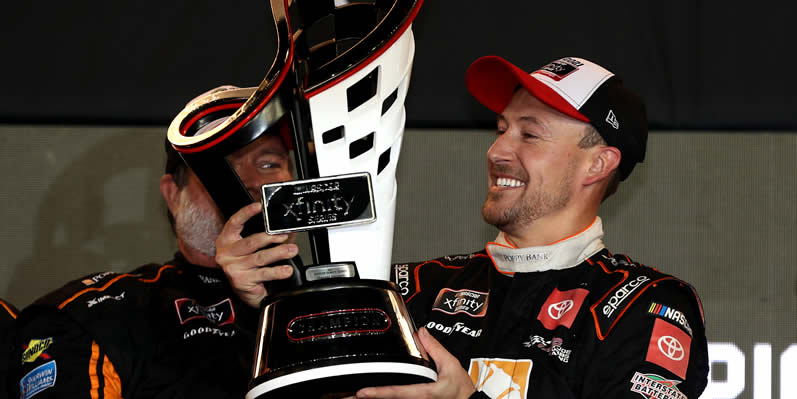
Daniel Hemric bags Xfinity championship with first NASCAR national series win
Daniel Hemric picked the perfect time to win his first NASCAR national series race—and a title came with it.
Executing an aggressive bump-and-run in Saturday night's NASCAR Xfinity Series Championship Race, Hemric passed Austin Cindric in the final two corners at Phoenix Raceway.
Approaching the finish line, the cars collided side-to-side, with Hemric crossing the stripe .030 seconds ahead of Cindric—roughly five feet—denying the driver of the No. 22 Team Penske Ford a second straight championship.
The victory came in Hemric's 208th NASCAR national series start, silencing critics who kept asking, "Will Hemric ever win a race?"
The answer came from crew chief Dave Rogers moments after the winning driver crossed the stripe and clinched the title.
"How about that, champion?" Rogers said. "You'll never have to hear that stupid question again."
"Never again!" Hemric shouted in reply.
Hemric, who is leaving the No. 18 Joe Gibbs Racing Toyota in favor of a ride with Kaulig Racing next year, was unapologetic about moving Cindric's Ford up the track to win the race at the end of a two-lap overtime that extended the event from 200 to 204 laps.
"I'm blacked out, blacked out," Hemric said at the start/finish line after turning a back flip off the roof of his car. "Just knew I had to be the first one to the line. I thought I let him get too much of a run off of (Turn) 4 (on the first lap of overtime).
"Drove into (Turn) 1, knew I was close, not to completely use them up, but we work our asses off for an opportunity like this—excuse my language. This is what it's all about, winning at the second highest level in all of motorsports. What an honor...
"How about those race fans? That back flip good enough for you? I've been waiting a long damn time to do that."
Cindric took the loss with consummate grace.
"Until you spin somebody out, it's not dirty racing," said Cindric, who entered the championship event with five wins to his credit this season. "If everyone in the stands enjoyed it, it's good racing.
"I'm appreciative of the opportunity to race on such a big stage, race for Roger Penske, represent Ford Performance, all of our sponsors that helped us this season. It would have been awesome to finish this out. I felt like we had a dominant race car, felt like we did everything right. Come up a little short."
As a consolation prize, Cindric secured the Xfinity Series Owners Championship for Roger Penske with his runner-up result.
The other two Championship 4 drivers - Noah Gragson and AJ Allmendinger - were in contention at the end. Gragson slammed the wall shortly after a restart on Lap 193 and fell to 12th at the finish.
Allmendinger suffered a loose wheel late in the race and spun in Turn 2 on Lap 181, causing the eighth of 10 cautions. Cindric, who led a race-high 113 laps, had a commanding lead at the time, but the yellow bunched the field and set up the late-race shootout.
Harrison Burton ran third on Saturday, followed by Riley Herbst and Justin Haley. John Hunter Nemechek, Brandon Jones, Brett Moffitt, Justin Allgaier and Sheldon Creed completed the top 10.
- Drivers Entered: 36
- Laps Scheduled: 200
- Laps Actual: 204 - NASCAR OVERTIME!
- Margin of Victory: 0.030 Seconds
- Time of Race: 2 Hours 22 Minutes 35 Seconds
- Average Speed: 85.845
- Cautions: 10 for 61 laps
- Lead Changes: 16
- Green Flag Passes: 1,833 (12.8 passes per green flag lap)
- Phoenix Raceway
- 23rd Annual NASCAR Xfinity Series Championship Race
- Race Winner: Daniel Hemric
- Age: 30
- Team : No. 18 - Poppy Bank Toyota
- Owner: Joe Gibbs Racing
- Crew Chief: Dave Rogers
- Daniel Hemric won the 23rd Annual NASCAR Xfinity Series Championship Race, his first victory in 120 Xfinity Series races.
- This is his first victory and 21st top-10 finish in 2021.
- This is his first victory and fifth top-10 finish in eight races at Phoenix Raceway.
- Austin Cindric (second) posted his seventh top-10 finish in eight races at Phoenix Raceway. It is his 26th top-10 finish in 2021.
- Harrison Burton (third) posted his third top-10 finish in four races at Phoenix Raceway.
- Sam Mayer (13th) was the highest finishing rookie.
- Daniel Hemric wins the 2021 NASCAR Xfinity Series Driver Championship.
- Team Penske's No. 22 team with driver Austin Cindric has won the 2021 NASCAR Xfinity Series Owners Championship.
- Ty Gibbs wins the 2021 NASCAR Xfinity Series Sunoco Rookie of the Year honors.
- Chevrolet has clinched the 2021 NASCAR Xfinity Series Manufacturers Championship - their series leading 22nd title.
- Driver Champion: Daniel Hemric
- Team: No. 18 Joe Gibbs Racing Toyota Supra
- Daniel Hemric has won his first NASCAR Xfinity Series championship (2021).
- Hemric is the 31st different drivers to win the NASCAR Xfinity Series driver championship.
- Hemric won the season finale at Phoenix Raceway to claim the 2021 NASCAR Xfinity Series title – his first career victory.
- Hemric made 33 starts this season posting one win, 15 top fives and 21 top 10s.
- In the Playoffs this season, Hemric has posted one win, six top fives and six top 10s.
- Hemric (Kannapolis) has become the seventh NASCAR Xfinity Series champion from the state of North Carolina; joining William Byron (2017 champion, Charlotte, N.C.), Austin Dillon (2013, Welcome, N.C.), Brian Vickers (2003, Thomasville, N.C.), Dale Earnhardt Jr. (1998, 1999, Kannapolis, N.C.), Jack Ingram (1985, 1982, Asheville, N.C.) and Sam Ard (1983, 1984, Asheboro, N.C.).
- Driver Owner Champion: Joe Gibbs, Joe Gibbs Racing
- This is Joe Gibbs Racing's third NASCAR Xfinity Series driver championships (Kyle Busch, 2009, Daniel Suarez, 2019 and Daniel Hemric, 2021). Joe Gibbs Racing also has five NASCAR Xfinity Series owner championship (2008, 2009, 2010, 2012, 2016).
- Joe Gibbs Racing is one of 20 different organizations to win the NASCAR Xfinity Series driver championship, and one of 19 different organizations to win the owner championship.
- Joe Gibbs Racing has posted 185 NASCAR Xfinity Series wins among 20 different drivers – Aric Almirola, Bobby Labonte, Brandon Jones, Christopher Bell, Daniel Suarez, Denny Hamlin, Elliott Sadler, Erik Jones Harrison Burton, Joey Logano, John Hunter Nemechek, Kyle Busch, Matt Kenseth, Mike Bliss, Mike McLaughlin, Ryan Preece, Sam Hornish Jr., Tony Stewart, Ty Gibbs and Daniel Hemric.
- Joe Gibbs Racing began its NASCAR Xfinity Series program in 1997 at Rockingham Speedway with NASCAR Hall of Famer driver Bobby Labonte.
- Crew Chief Champion: Dave Rogers
- This is Dave Rogers first career NASCAR Xfinity Series championship (2021). Rogers previous best finish in the Xfinity Series championship standings was fourth with Denny Hamlin in 2006.
- Rogers is the 29th different crew chief to win the NASCAR Xfinity Series title.
- Rogers has won 21 NASCAR Xfinity Series races with six different drivers: Denny Hamlin, Tony Stewart, Aric Almirola, Kyle Busch, Joey Logano and Daniel Hemric.
- Owner Champion: Team Penske (No. 22)
- This is Team Penske's series leading sixth NASCAR Xfinity Series owner championship (2013, 2014, 2015, 2017, 2020, 2021). Clinched this season's title with driver Austin Cindric and the No. 22 team.
- Owner Roger Penske fielded the team's first car in the series with NASCAR Hall of Famer Rusty Wallace behind the wheel at Auto Club Speedway on October 19, 1997.
| DRIVER | ST | MID | CLO | FIN | HI | LOW | ARP | PL DIF | GFP | GFxP | PD | QPS | % QPS | FST | % T15 | LED | % LED | LAPS | DR | TOT PTS |
|---|---|---|---|---|---|---|---|---|---|---|---|---|---|---|---|---|---|---|---|---|
| Daniel Hemric | 4 | 1 | 2 | 1 | 1 | 7 | 2.2 | 3 | 10 | 9 | 1 | 10 | 100.00 | 26 | 100.0 | 48 | 23.5 | 204 | 127.70 | 40 |
| Austin Cindric | 1 | 2 | 1 | 2 | 1 | 6 | 1.7 | -1 | 15 | 11 | 4 | 14 | 93.33 | 55 | 100.0 | 113 | 55.4 | 204 | 144.70 | 35 |
| Harrison Burton | 36 | 6 | 5 | 3 | 3 | 36 | 8.9 | 33 | 79 | 54 | 25 | 42 | 53.16 | 5 | 89.7 | 0 | 0.0 | 204 | 95.70 | 37 |
| Riley Herbst | 5 | 10 | 8 | 4 | 4 | 14 | 9.7 | 1 | 42 | 45 | -3 | 40 | 95.24 | 1 | 100.0 | 0 | 0.0 | 204 | 95.10 | 36 |
| Justin Haley | 8 | 9 | 6 | 5 | 4 | 13 | 7.4 | 3 | 36 | 40 | -4 | 35 | 97.22 | 1 | 100.0 | 0 | 0.0 | 204 | 103.50 | 37 |
| John Hunter Nemechek | 2 | 3 | 3 | 6 | 1 | 9 | 2.6 | -4 | 28 | 25 | 3 | 25 | 89.29 | 23 | 100.0 | 39 | 19.1 | 204 | 122.40 | 0 |
| Brandon Jones | 6 | 7 | 11 | 7 | 2 | 17 | 9.4 | -1 | 49 | 68 | -19 | 42 | 85.71 | 5 | 95.6 | 0 | 0.0 | 204 | 90.80 | 35 |
| Brett Moffitt | 20 | 20 | 12 | 8 | 7 | 23 | 16.0 | 12 | 83 | 58 | 25 | 37 | 44.58 | 0 | 52.9 | 0 | 0.0 | 204 | 77.80 | 29 |
| Justin Allgaier | 3 | 5 | 13 | 9 | 1 | 31 | 8.0 | -6 | 64 | 39 | 25 | 30 | 46.88 | 8 | 87.3 | 0 | 0.0 | 204 | 100.40 | 42 |
| Sheldon Creed | 10 | 11 | 15 | 10 | 2 | 30 | 13.6 | 0 | 65 | 54 | 11 | 38 | 58.46 | 0 | 76.5 | 0 | 0.0 | 204 | 80.80 | 0 |
| Michael Annett | 13 | 8 | 7 | 11 | 1 | 14 | 9.1 | 2 | 57 | 42 | 15 | 51 | 89.47 | 1 | 100.0 | 1 | 0.5 | 204 | 92.60 | 31 |
| Noah Gragson | 7 | 12 | 4 | 12 | 1 | 26 | 6.8 | -5 | 42 | 29 | 13 | 27 | 64.29 | 3 | 94.1 | 3 | 1.5 | 204 | 104.90 | 25 |
| Sam Mayer | 11 | 14 | 10 | 13 | 9 | 23 | 13.4 | -2 | 74 | 60 | 14 | 53 | 71.62 | 1 | 88.7 | 0 | 0.0 | 204 | 81.30 | 24 |
| AJ Allmendinger | 12 | 4 | 20 | 14 | 2 | 21 | 7.8 | -2 | 42 | 39 | 3 | 37 | 88.10 | 3 | 95.6 | 0 | 0.0 | 204 | 96.70 | 23 |
| Dylan Lupton | 32 | 21 | 16 | 15 | 13 | 35 | 21.2 | 17 | 76 | 68 | 8 | 12 | 15.79 | 0 | 7.4 | 0 | 0.0 | 204 | 63.50 | 22 |
| Blaine Perkins | 21 | 27 | 25 | 16 | 14 | 29 | 23.3 | 5 | 54 | 58 | -4 | 8 | 14.81 | 0 | 3.4 | 0 | 0.0 | 204 | 61.20 | 21 |
| Ryan Sieg | 14 | 16 | 14 | 17 | 14 | 26 | 16.3 | -3 | 62 | 56 | 6 | 13 | 20.97 | 0 | 43.6 | 0 | 0.0 | 204 | 71.50 | 20 |
| Jeremy Clements | 22 | 18 | 18 | 18 | 13 | 22 | 18.4 | 4 | 59 | 65 | -6 | 1 | 1.69 | 0 | 1.0 | 0 | 0.0 | 204 | 67.20 | 19 |
| Myatt Snider | 17 | 15 | 17 | 19 | 8 | 19 | 14.7 | -2 | 55 | 71 | -16 | 44 | 80.00 | 0 | 57.4 | 0 | 0.0 | 204 | 70.50 | 18 |
| Brandon Brown | 19 | 17 | 21 | 20 | 10 | 23 | 18.7 | -1 | 74 | 76 | -2 | 4 | 5.41 | 0 | 4.4 | 0 | 0.0 | 204 | 63.80 | 17 |
| David Starr | 27 | 31 | 27 | 21 | 9 | 36 | 29.8 | 6 | 49 | 50 | -1 | 0 | 0.00 | 0 | 0.0 | 0 | 0.0 | 204 | 39.20 | 16 |
| JJ Yeley | 29 | 28 | 24 | 22 | 17 | 36 | 27.2 | 7 | 71 | 68 | 3 | 0 | 0.00 | 0 | 0.0 | 0 | 0.0 | 204 | 47.00 | 15 |
| Jeb Burton | 9 | 13 | 9 | 23 | 6 | 30 | 11.3 | -14 | 37 | 56 | -19 | 31 | 83.78 | 0 | 91.2 | 0 | 0.0 | 204 | 78.20 | 14 |
| Tommy Joe Martins | 23 | 24 | 19 | 24 | 18 | 34 | 25.1 | -1 | 63 | 65 | -2 | 0 | 0.00 | 0 | 0.0 | 0 | 0.0 | 204 | 51.00 | 13 |
| Sage Karam | 33 | 29 | 26 | 25 | 7 | 33 | 28.2 | 8 | 68 | 64 | 4 | 0 | 0.00 | 0 | 0.0 | 0 | 0.0 | 204 | 41.30 | 12 |
| Kyle Weatherman | 24 | 25 | 28 | 26 | 11 | 30 | 24.8 | -2 | 49 | 51 | -2 | 0 | 0.00 | 0 | 0.5 | 0 | 0.0 | 204 | 48.30 | 11 |
| Kyle Sieg | 18 | 30 | 23 | 27 | 18 | 32 | 27.1 | -9 | 68 | 69 | -1 | 0 | 0.00 | 0 | 0.0 | 0 | 0.0 | 204 | 46.30 | 10 |
| Ryan Vargas | 30 | 34 | 30 | 28 | 27 | 36 | 33.0 | 2 | 17 | 29 | -12 | 0 | 0.00 | 0 | 0.0 | 0 | 0.0 | 204 | 31.30 | 9 |
| Matt Mills | 35 | 26 | 31 | 29 | 20 | 35 | 28.6 | 6 | 24 | 42 | -18 | 0 | 0.00 | 0 | 0.0 | 0 | 0.0 | 204 | 35.00 | 8 |
| Alex Labbe | 26 | 19 | 32 | 30 | 16 | 33 | 24.2 | -4 | 36 | 58 | -22 | 0 | 0.00 | 0 | 0.0 | 0 | 0.0 | 202 | 50.00 | 7 |
| Bayley Currey | 25 | 33 | 33 | 31 | 23 | 36 | 31.8 | -6 | 38 | 43 | -5 | 0 | 0.00 | 0 | 0.0 | 0 | 0.0 | 200 | 32.80 | 0 |
| Josh Williams | 16 | 22 | 22 | 32 | 15 | 28 | 22.2 | -16 | 79 | 89 | -10 | 0 | 0.00 | 0 | 0.0 | 0 | 0.0 | 194 | 50.80 | 5 |
| Jade Buford | 15 | 23 | 29 | 33 | 4 | 30 | 22.5 | -18 | 66 | 73 | -7 | 8 | 12.12 | 0 | 10.8 | 0 | 0.0 | 193 | 50.30 | 4 |
| Stefan Parsons | 28 | 32 | 34 | 34 | 25 | 36 | 31.9 | -6 | 40 | 39 | 1 | 0 | 0.00 | 0 | 0.0 | 0 | 0.0 | 123 | 36.50 | 3 |
| Joe Graf Jr | 34 | 35 | 35 | 35 | 25 | 36 | 33.6 | -1 | 39 | 35 | 4 | 0 | 0.00 | 0 | 0.0 | 0 | 0.0 | 97 | 26.50 | 2 |
| Jeffrey Earnhardt | 31 | 36 | 36 | 36 | 26 | 36 | 35.4 | -5 | 23 | 34 | -11 | 0 | 0.00 | 0 | 0.0 | 0 | 0.0 | 57 | 24.30 | 1 |