
Loop Data Box Score : Mid Ohio Sports Car Course
B&L Transport 170
Mid Ohio Sports Car Course , Lexington, OH
-
27

-
8

-
3

- Mid-Ohio Sports Car Course
- 7th Annual B&L Transport 170 at Mid-Ohio
- Pole Winner: Austin Cindric
- Age: 20
- Team : No. 22 - PPG Ford
- Owner: Team Penske
- Crew Chief: Brian Wilson
- Austin Cindric won the Pole Award for the 7th Annual B&L Transport 170 at Mid-Ohio with a lap of 84.231 seconds, 96.506 mph.
- This is his fifth pole in 55 NASCAR Xfinity Series races.
- This is his second pole and 17th top-10 start in 2019.
- This is his second pole in two races at Mid-Ohio Sports Car Course.
- Jack Hawksworth (second) posted his first top-10 start of 2019 and his first at Mid-Ohio Sports Car Course.
- Christopher Bell (third) posted his second top-10 start at Mid-Ohio Sports Car Course. It is his 20th in 21 races this season.
- Chase Briscoe (fifth) was the fastest qualifying rookie.
- Drivers Entered: 38
- Laps Scheduled: 75
- Margin of Victory: 03.780 Seconds
- Time of Race: 2 Hours 22 Minutes 14 Seconds
- Average Speed: 71.439
- Cautions: 6 for 17 laps
- Lead Changes: 10
- Green Flag Passes: 1,142 (19.7 passes per green flag lap)
- Mid-Ohio Sports Car Course
- 7th Annual B&L Transport 170 at Mid-Ohio
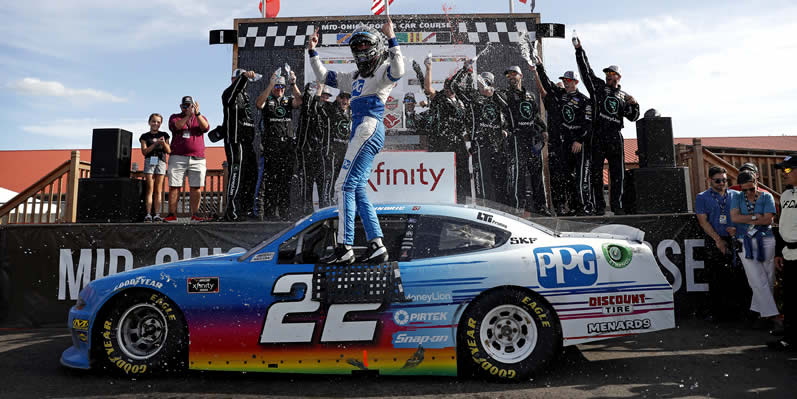
- Race Winner: Austin Cindric
- Age: 20
- Team : No. 22 - PPG Ford
- Owner: Team Penske
- Crew Chief: Brian Wilson
- Austin Cindric won the 7th Annual B&L Transport 170 at Mid-Ohio, his second victory in 55 Xfinity Series races.
- This is his second victory and 15th top-10 finish in 2019.
- This is his first victory and second top-10 finish in two races at Mid-Ohio Sports Car Course.
- Christopher Bell (second) posted his first top-10 finish in two races at Mid-Ohio Sports Car Course. It is his 15th top-10 finish in 2019.
- AJ Allmendinger (third) posted his second top-10 finish in two races at Mid-Ohio Sports Car Course.
- Noah Gragson (fifth) was the highest finishing rookie.
- Tyler Reddick leads the point standings by 28 points over Christopher Bell.
- Cindric becomes the sixth different NASCAR Xfinity Series driver to win their first two races back-to-back joining William Byron (2017), Jamie McMurray (2002), Chad Little (1995), Steve Grissom (1990), Rick Mast (1987).
Want to know more about Loop Data?: I've put together a complete resource for NASCAR Loop Data insights and show how loop data can help you in fantasy, DFS and wagering.
| DRIVER | ST | MID | CLO | FIN | HI | LOW | ARP | PL DIF | GFP | GFxP | PD | QPS | % QPS | FST | % T15 | LED | % LED | LAPS | DR | TOT PTS |
|---|---|---|---|---|---|---|---|---|---|---|---|---|---|---|---|---|---|---|---|---|
| Austin Cindric | 1 | 3 | 1 | 1 | 1 | 18 | 2.1 | 0 | 21 | 25 | -4 | 12 | 57.14 | 35 | 98.7 | 46 | 61.3 | 75 | 150.00 | 48 |
| Christopher Bell | 3 | 2 | 2 | 2 | 1 | 15 | 2.7 | 1 | 25 | 23 | 2 | 18 | 72.00 | 10 | 100.0 | 15 | 20.0 | 75 | 124.10 | 44 |
| AJ Allmendinger | 6 | 5 | 3 | 3 | 3 | 23 | 5.4 | 3 | 23 | 28 | -5 | 16 | 69.57 | 0 | 96.0 | 0 | 0.0 | 75 | 114.50 | 40 |
| Tyler Reddick | 10 | 4 | 4 | 4 | 1 | 23 | 6.8 | 6 | 28 | 30 | -2 | 16 | 57.14 | 1 | 92.0 | 0 | 0.0 | 75 | 111.90 | 40 |
| Noah Gragson | 7 | 29 | 5 | 5 | 1 | 30 | 10.1 | 2 | 57 | 61 | -4 | 25 | 43.86 | 1 | 86.7 | 1 | 1.3 | 75 | 104.00 | 41 |
| Justin Allgaier | 8 | 22 | 6 | 6 | 3 | 22 | 8.3 | 2 | 35 | 42 | -7 | 22 | 62.86 | 1 | 89.3 | 0 | 0.0 | 75 | 105.50 | 31 |
| Chase Briscoe | 5 | 30 | 8 | 7 | 1 | 33 | 11.9 | -2 | 33 | 38 | -5 | 24 | 72.73 | 1 | 76.0 | 5 | 6.7 | 75 | 98.60 | 40 |
| Cole Custer | 4 | 12 | 9 | 8 | 3 | 17 | 9.3 | -4 | 46 | 34 | 12 | 35 | 76.09 | 1 | 97.3 | 0 | 0.0 | 75 | 100.20 | 34 |
| Justin Haley | 13 | 8 | 7 | 9 | 4 | 31 | 12.4 | 4 | 55 | 27 | 28 | 20 | 36.36 | 0 | 69.3 | 0 | 0.0 | 75 | 91.00 | 31 |
| Brandon Jones | 9 | 17 | 11 | 10 | 3 | 31 | 12.8 | -1 | 35 | 21 | 14 | 16 | 45.71 | 0 | 70.7 | 0 | 0.0 | 75 | 90.20 | 34 |
| Jeremy Clements | 11 | 19 | 13 | 11 | 2 | 20 | 12.8 | 0 | 34 | 22 | 12 | 19 | 55.88 | 0 | 74.7 | 0 | 0.0 | 75 | 85.30 | 34 |
| Will Rodgers | 22 | 20 | 10 | 12 | 2 | 33 | 16.5 | 10 | 42 | 52 | -10 | 12 | 28.57 | 1 | 44.0 | 0 | 0.0 | 75 | 76.90 | 25 |
| Michael Annett | 21 | 16 | 12 | 13 | 1 | 32 | 14.1 | 8 | 44 | 27 | 17 | 17 | 38.64 | 1 | 64.0 | 1 | 1.3 | 75 | 81.90 | 28 |
| Gray Gaulding | 16 | 6 | 15 | 14 | 5 | 31 | 14.3 | 2 | 35 | 40 | -5 | 12 | 34.29 | 0 | 74.7 | 0 | 0.0 | 75 | 77.00 | 28 |
| Jack Hawksworth | 2 | 1 | 18 | 15 | 1 | 25 | 7.7 | -13 | 43 | 51 | -8 | 24 | 55.81 | 0 | 85.3 | 5 | 6.7 | 75 | 89.80 | 0 |
| Ryan Sieg | 14 | 7 | 14 | 16 | 5 | 27 | 13.6 | -2 | 50 | 18 | 32 | 20 | 40.00 | 0 | 77.3 | 0 | 0.0 | 75 | 77.80 | 31 |
| Josh Bilicki | 20 | 13 | 16 | 17 | 10 | 33 | 19.4 | 3 | 47 | 24 | 23 | 5 | 10.64 | 0 | 9.3 | 0 | 0.0 | 75 | 67.80 | 21 |
| Tommy Joe Martins | 18 | 10 | 17 | 18 | 8 | 28 | 17.0 | 0 | 31 | 51 | -20 | 1 | 3.23 | 0 | 28.0 | 0 | 0.0 | 75 | 67.70 | 20 |
| Ray Black II | 26 | 26 | 21 | 19 | 15 | 36 | 26.6 | 7 | 28 | 22 | 6 | 0 | 0.00 | 0 | 1.3 | 0 | 0.0 | 75 | 56.50 | 18 |
| Garrett Smithley | 28 | 15 | 20 | 20 | 14 | 32 | 22.6 | 8 | 42 | 21 | 21 | 3 | 7.14 | 1 | 9.3 | 0 | 0.0 | 75 | 58.90 | 17 |
| Regan Smith | 12 | 11 | 22 | 21 | 1 | 28 | 14.8 | -9 | 44 | 59 | -15 | 11 | 25.00 | 0 | 53.3 | 1 | 1.3 | 75 | 67.50 | 0 |
| Josh Williams | 23 | 18 | 19 | 22 | 1 | 34 | 22.6 | 1 | 36 | 85 | -49 | 2 | 5.56 | 0 | 5.3 | 1 | 1.3 | 75 | 52.20 | 15 |
| Patrick Gallagher | 37 | 24 | 23 | 23 | 11 | 37 | 25.2 | 14 | 36 | 19 | 17 | 0 | 0.00 | 0 | 1.3 | 0 | 0.0 | 74 | 49.80 | 0 |
| Brandon Brown | 32 | 25 | 24 | 24 | 2 | 34 | 23.0 | 8 | 35 | 47 | -12 | 5 | 14.29 | 1 | 12.0 | 0 | 0.0 | 74 | 54.50 | 13 |
| Vinnie Miller | 35 | 28 | 25 | 25 | 18 | 35 | 29.2 | 10 | 22 | 16 | 6 | 0 | 0.00 | 0 | 0.0 | 0 | 0.0 | 74 | 39.70 | 12 |
| BJ McLeod | 33 | 27 | 26 | 26 | 13 | 34 | 28.6 | 7 | 25 | 17 | 8 | 0 | 0.00 | 1 | 1.3 | 0 | 0.0 | 73 | 41.50 | 11 |
| Timmy Hill | 25 | 21 | 28 | 27 | 2 | 32 | 25.9 | -2 | 22 | 53 | -31 | 2 | 9.09 | 1 | 5.3 | 0 | 0.0 | 65 | 47.00 | 10 |
| Lawson Aschenbach | 19 | 14 | 27 | 28 | 5 | 29 | 19.7 | -9 | 42 | 53 | -11 | 7 | 16.67 | 0 | 10.7 | 0 | 0.0 | 63 | 63.70 | 0 |
| Scott Heckert | 17 | 23 | 29 | 29 | 7 | 30 | 23.0 | -12 | 26 | 20 | 6 | 4 | 15.38 | 0 | 10.7 | 0 | 0.0 | 57 | 55.70 | 10 |
| Aaron Quine | 31 | 31 | 30 | 30 | 21 | 35 | 29.8 | 1 | 25 | 10 | 15 | 0 | 0.00 | 1 | 0.0 | 0 | 0.0 | 42 | 39.90 | 0 |
| John Hunter Nemechek | 15 | 9 | 31 | 31 | 7 | 31 | 21.8 | -16 | 9 | 28 | -19 | 3 | 33.33 | 0 | 38.7 | 0 | 0.0 | 41 | 62.00 | 8 |
| Stephen Leicht | 24 | 32 | 32 | 32 | 9 | 26 | 27.3 | -8 | 21 | 14 | 7 | 2 | 9.52 | 0 | 5.3 | 0 | 0.0 | 36 | 42.50 | 5 |
| David Starr | 29 | 33 | 33 | 33 | 16 | 31 | 29.5 | -4 | 32 | 14 | 18 | 0 | 0.00 | 0 | 0.0 | 0 | 0.0 | 36 | 36.20 | 4 |
| Chris Dyson | 27 | 34 | 34 | 34 | 11 | 33 | 29.0 | -7 | 7 | 34 | -27 | 0 | 0.00 | 0 | 12.0 | 0 | 0.0 | 31 | 37.50 | 0 |
| Chad Finchum | 34 | 35 | 35 | 35 | 32 | 37 | 34.8 | -1 | 4 | 5 | -1 | 0 | 0.00 | 0 | 0.0 | 0 | 0.0 | 13 | 28.80 | 2 |
| Joey Gase | 30 | 36 | 36 | 36 | 29 | 35 | 35.4 | -6 | 1 | 10 | -9 | 0 | 0.00 | 0 | 0.0 | 0 | 0.0 | 8 | 27.70 | 1 |
| JJ Yeley | 36 | 37 | 37 | 37 | 36 | 37 | 37.0 | -1 | 1 | 1 | 0 | 0 | 0.00 | 0 | 0.0 | 0 | 0.0 | 2 | 25.30 | 0 |
| Max Tullman | 38 | 38 | 38 | 38 | 38 | 38 | 38.0 | 0 | 0 | 0 | 0 | 0 | 0.00 | 0 | 0.0 | 0 | 0.0 | 2 | 24.20 | 1 |