Pit Stops : Talladega Superspeedway

  • 27
  • 7
  • 8

  • Talladega Superspeedway
  • Ag-Pro 300
  • Pole Winner: Austin Hill
  • Age: 29
  • Team : No. 21 - Bennett/Realtree Chevrolet
  • Owner: Richard Childress
  • Crew Chief: Andy Street
  • Austin Hill won the Pole Award for the Ag-Pro 300 with a lap of 52.483 seconds, 182.459 mph.
  • This is his third pole in 57 NASCAR Xfinity Series races.
  • This is his second pole and sixth top-10 start in 2023.
  • This is his second pole in four races at Talladega Superspeedway.
  • Sheldon Creed (second) posted his seventh top-10 start of 2023 and his third in three races at Talladega Superspeedway.
  • John Hunter Nemechek (third) posted his second top-10 start at Talladega Superspeedway. It is his ninth in nine races this season.
  • Parker Retzlaff (fourth) was the fastest qualifying rookie.

  • Drivers Entered: 42 (4 drivers will not make the race)
  • Laps Scheduled: 113
  • Laps Actual: 121 - NASCAR OVERTIME!
  • Margin of Victory: 0.113 Seconds
  • Time of Race: 3 Hours 0 Minutes 33 Seconds
  • Average Speed: 106.960
  • Cautions: 10 for 48 laps
  • Lead Changes: 28
  • Green Flag Passes: 6,625 (90.8 passes per green flag lap)

  • Talladega Superspeedway
  • Ag-Pro 300
  • Race Winner: Jeb Burton
  • Age: 30
  • Team : No. 27 - Solid Rock Carriers Chevrolet
  • Owner: Jordan Anderson
  • Crew Chief: Shane Whitbeck
  • Jeb Burton won the Ag-Pro 300, his second victory in 118 Xfinity Series races.
  • This is his first victory and first top-10 finish in 2023.
  • This is his second victory and fourth top-10 finish in seven races at Talladega Superspeedway.
  • Sheldon Creed (second) posted his first top-10 finish in three races at Talladega Superspeedway. It is his fifth top-10 finish in 2023.
  • Parker Kligerman (third) posted his third top-10 finish in four races at Talladega Superspeedway.
  • Parker Retzlaff (seventh) was the highest finishing rookie.
  • Austin Hill leads the point standings by 4 points over John Hunter Nemechek.
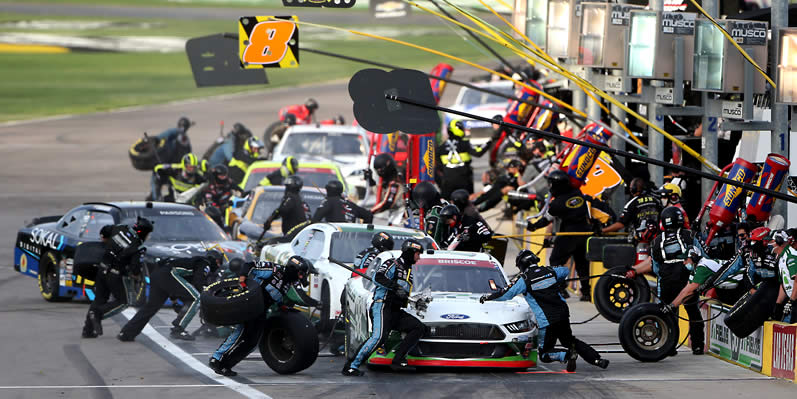
Xfinity Series pit stops at Las Vegas Motor Speedway
Las Vegas, Nevada - September 25, 2020 : Xfinity Series pit stops at Las Vegas Motor Speedway
Brian LawdermilkGetty Images

Pit Stop Summary Report

Aggregate of each driver's pit stops during the race.

 
DRIVER
START
FINISH
STATUS
# STOPS
DRIVER / PIT CREW
FASTEST
SLOWEST
AVG TIME
RANK
DRIVER
AVG TIME
RANK
PIT CREW
AVG TIME
RANK

Ryan Truex
13
17
Running
2
31.387
31.736
31.561
1
24.638
4
6.923
1
Ryan Sieg
31
22
Accident
1
33.403
33.403
33.403
2
24.928
9
8.475
2
Sammy Smith
12
33
Accident
2
32.818
36.959
34.889
3
25.363
18
9.526
3
Jeremy Clements
37
19
Accident
2
32.564
37.825
35.194
4
25.502
21
9.693
4
Josh Williams
23
10
Running
1
35.639
35.639
35.639
5
25.496
20
10.143
5
Sam Mayer
16
29
Accident
2
32.529
40.356
36.443
6
24.981
11
11.461
7
John Hunter Nemechek
3
32
Accident
3
33.532
42.481
36.651
7
25.107
13
11.545
8
Justin Allgaier
7
28
Accident
4
32.898
40.272
36.808
8
24.721
6
12.087
9
Chandler Smith
11
25
Accident
2
33.857
41.456
37.657
9
25.413
19
12.244
10
CJ McLaughlin
32
13
Running
1
38.090
38.090
38.090
10
27.814
27
10.276
6
Daniel Hemric
9
21
Accident
3
31.940
42.253
38.395
11
24.930
10
13.465
12
Parker Kligerman
38
3
Running
2
34.796
43.444
39.120
12
25.756
23
13.364
11
Derek Kraus
14
27
DVP
3
32.583
44.879
39.696
13
25.326
17
14.369
13
Sheldon Creed
2
2
Running
3
38.964
41.529
40.151
14
24.402
1
15.749
18
Austin Hill
1
18
Running
3
38.747
42.775
40.384
15
24.791
8
15.593
17
Riley Herbst
15
23
Accident
2
39.654
41.521
40.587
16
25.012
12
15.576
16
Josh Bilicki
35
26
Accident
2
36.702
46.548
41.625
17
26.143
24
15.482
15
Brandon Jones
21
14
Running
2
40.559
42.848
41.703
18
24.403
2
17.300
21
Cole Custer
18
4
Running
3
39.974
44.473
41.763
19
24.468
3
17.295
20
Brett Moffitt
10
12
Running
1
42.156
42.156
42.156
20
24.672
5
17.484
22

Pit Stop Detailed Report

Each 2- and 4-wheel pit stop during the race.

DRIVER
LEADER LAP
DRIVER LAP
DRIVER TIME
CREW TIME
TOTAL
TYPE

Ryan Truex
27
27
24.914
6.473
31.387
TWO WHEEL CHANGE LEFT
Ryan Truex
50
50
24.362
7.374
31.736
TWO WHEEL CHANGE RIGHT
Justin Allgaier
65
65
24.857
8.041
32.898
TWO WHEEL CHANGE RIGHT
Justin Allgaier
27
27
24.827
10.477
35.304
TWO WHEEL CHANGE LEFT
Justin Allgaier
83
83
24.409
14.348
38.757
FOUR WHEEL CHANGE
Justin Allgaier
50
50
24.790
15.482
40.272
FOUR WHEEL CHANGE
Parker Kligerman
65
65
25.887
8.909
34.796
TWO WHEEL CHANGE RIGHT
Parker Kligerman
50
50
25.626
17.818
43.444
FOUR WHEEL CHANGE
Brett Moffitt
50
50
24.672
17.484
42.156
FOUR WHEEL CHANGE
Jeb Burton
50
50
24.637
16.850
41.487
FOUR WHEEL CHANGE
Jeb Burton
75
75
25.246
17.717
42.963
FOUR WHEEL CHANGE
Jeb Burton
27
27
24.322
18.919
43.241
FOUR WHEEL CHANGE
Jeffrey Earnhardt
65
65
25.223
18.084
43.307
FOUR WHEEL CHANGE
Ryan Ellis
104
104
29.559
10.077
39.636
TWO WHEEL CHANGE LEFT
Ryan Ellis
51
51
26.964
20.087
47.051
FOUR WHEEL CHANGE
Gray Gaulding
65
65
26.203
20.387
46.590
FOUR WHEEL CHANGE
Gray Gaulding
39
39
27.230
20.853
48.083
FOUR WHEEL CHANGE
Ryan Sieg
50
50
24.928
8.475
33.403
TWO WHEEL CHANGE RIGHT
Daniel Hemric
75
75
24.878
7.062
31.940
TWO WHEEL CHANGE RIGHT
Daniel Hemric
39
39
25.045
15.948
40.993
FOUR WHEEL CHANGE