
Accupredict Driver Finish Projections
Accupredict driver finish projections for the upcoming race. It ain't rocket science. But it's pretty darn close!
Accupredict Performance History at this Track and Track Type
Daytona International Speedway
- 28 races
- 4 winners picked
- 98 correct top-10's
- Avg -0.89 positions off
- 12.29 std dev off
- 1125 drivers evaluated
Restrictor Plate Track Group
- 75 races
- 10 winners picked
- 302 correct top-10's
- Avg -0.68 positions off
- 11.47 std dev off
- 2,977 drivers evaluated
Sleepers / Under-ranked Contenders
Ideal for DFS pivots, fantasy sleepers, or value betting plays. These drivers are ranked outside the Top-10 in AP projections, but their historical Driver Rating at this track suggests they could finish much better.

Chris Buescher
AP Rank: 25th
Projected Finish: 20.63
Track Driver Rating: 91.26
Potential Top-20 Breakouts
Could be a sneaky DFS Value Pick or Long Shot Top-10 Bet. These drivers are currently ranked outside the Top-20 but have a strong statistical chance to outperform their ranking.

Denny Hamlin
AP Rank: 26th
Variance: +6 spots
Projected Finish: 20.73

Chris Buescher
AP Rank: 25th
Variance: +5 spots
Projected Finish: 20.63

Jimmie Johnson
AP Rank: 28th
Variance: +7 spots
Projected Finish: 21.52

Ryan Preece
AP Rank: 29th
Variance: +8 spots
Projected Finish: 21.55

Ross Chastain
AP Rank: 30th
Variance: +9 spots
Projected Finish: 21.62

Ty Gibbs
AP Rank: 27th
Variance: +6 spots
Projected Finish: 21.28

Carson Hocevar
AP Rank: 32nd
Variance: +10 spots
Projected Finish: 22.68
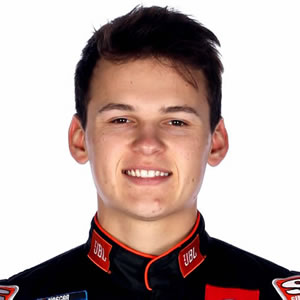
Corey Heim
AP Rank: 31st
Variance: +9 spots
Projected Finish: 22.15

Ty Dillon
AP Rank: 34th
Variance: +11 spots
Projected Finish: 23.86

Shane van Gisbergen
AP Rank: 33rd
Variance: +10 spots
Projected Finish: 23.57
Metrics Used
BOLD METRICS are currently contributing to projection. 4 of 6 (66.7%) metrics are in use.
- Qualifying
- Practice
- Recent Form
- YTD Driver Rating
- Track Type Form
- Track Driver Rating
Accupredict projections are recalculated as new race metric data is available. (Last updated Friday, February 13th @ 7:59pm ET)
VISUAL DRIVER PROJECTION RANGE
A visual breakdown of projected finish positions for each driver.
What This Graph Shows
- Each bar represents a driver’s projected finish range.
- Darker bars = More confidence in their position.
- Wider bars = More uncertainty (larger prediction range).
How to Read This
- Short Bars → Consistent, reliable drivers.
- Long Bars → Unpredictable, high variance.
- Rank Order → Sorted by best projected finish.
Your Strategy
- Short-range drivers: More reliable picks for DFS & betting.
- Long-range drivers: Higher risk, bigger upside.
Daytona 500
Daytona International Speedway , Daytona Beach, FL

Manufacturer Projected Odds
| MAKE | IN RACE | ODDS TO WIN | PCT TO WIN |
|---|---|---|---|
| Chevrolet | 21 | -250 | 69.3% |
| Ford | 13 | +350 | 22.4% |
| Toyota | 11 | +1100 | 8.2% |
-
21

-
13

-
11

- Fair Average Values in use: *
- Current Form: 23.17
- Track Type Form: 23.75
- Track Driver Rating: 68.20