Categories
By The Numbers

How The NASCAR Chase Grid Works

The 2014 NASCAR season introduces a new twist to the way the NASCAR Sprint Cup Champion is decided. You can follow the NASCAR Chase Grid as it fills out. Here is a run down on how it works.

CHASE FACTS AND FAQS

Q. Does this new Chase format emphasize winning?

A. Absolutely. The easiest way to make the new Chase for the NASCAR Sprint Cup is to win. And winning is also the fastest way to advance in the Chase and become one of the four drivers competing in the NASCAR Sprint Cup Championship at Homestead-Miami Speedway.

Q. How will the Chase Grid drivers be selected?

A. Positions 1-16 on the Chase Grid will be determined by the drivers with the greatest number of NASCAR Sprint Cup Series wins after the first 26 races. However, the 16th position is reserved for the points leader if he/she does not have a win.

Q. How will the Chase Grid be seeded?

A. All drivers will have their points total reset to 2,000 points. Drivers receive 3 additional bonus points for each win during the fir st 26 races.

Q. Is there a minimum points standing that a driver who records a win during the first 26 races must achieve to make the Chase Grid?

A. Yes. A driver must be in the Top 30 in the NASCAR Sprint Cup Series points following the first 26 races AND have attempted to qualify for all of the first 26 races.

Q. What if a driver is prevented from competing in one or more of the first 26 races due to injury or illness?

A. NASCAR, for rare instances, can waive the requirement of attempting to qualify for all of the first 26 races as long as the driver is in the Top 30 in points.

Q. Which races are the advancement races?

A. Once the field is reset after the 26th event, there are advancement races following the 29th event (Dover); 32nd event (Talladega); and 35th event (Phoenix). There will be four drivers competing for the Sprint Cup Championship at Homestead.

Q. Will lap leader bonus points still be applied?

A. In all but the final r ace, bonus points for laps led still will be awarded in the Challenger, Contender and Eliminator Rounds. However, at the NASCAR Sprint Cup Championship, the four drivers will start the race tied and there will be no bonus points .for laps led, etc. The highest finisher among that group will be the champion.

Q. What happens to a Chase Grid driver’s points if he/she doesn’t advance to the next round?

A. Drivers who don’t advance to the next round will have their point totals reset to the Chase-start base of 2,000 (with any regular-season wins bonus points), plus the additional points they’ve earned during the Chase.

CHALLENGER ROUND

3 Races / 16 Drivers

  • Chicagoland………………………………… 9/14
  • New Hampshire…………………………… 9/21
  • Dover………………………………………….. 9/28

Fast Facts: The 16 drivers on the Chase Grid will vie for the 12 spots available in the Contender Round. Challenger Round drivers who win a race in this round automatically advance to the next round. The rest of the Top 12 will be set by points and all drivers who advance will have their points reset to 3,000.

CONTENDER ROUND

3 Races / 12 Drivers

  • Kansas……………………………………….. 10/5
  • Charlotte…………………………………… 10/11
  • Talladega…………………………………… 10/19

Fast Facts: The Top 12 drivers will vie for the 8 spots available in the Eliminator Round. Contender Round drivers who win a race in this round automatically advance to the next round. The rest of the Top 8 will be set by points and all drivers who advance will have their points reset to 4,000.

ELIMINATOR ROUND

3 Races / 8 Drivers

  • Martinsville……………………………….. 10/26
  • Texas………………………………………….. 11/2
  • Phoenix………………………………………. 11/9

Fast Facts: The Top 8 drivers will vie for the 4 spots available in the NASCAR Sprint Cup Championship. Eliminator Round drivers who win a race in this round automatically advance to the finale. The rest of the Top 4 will be set by points and all drivers who advance will have their points reset to 5,000.

SPRINT CUP CHAMPIONSHIP

1 Race / 4 Drivers

  • Homestead-Miami……………………… 11/16

Fast Facts: The 36th and final race of the season will be the “NASCAR Sprint Cup Championship.” Simply stated, the first to the finish line among the remaining four eligible drivers will win the NASCAR Sprint Cup Series title.
Categories
By The Numbers Fantasy NASCAR

2014 NASCAR Driver Finish Predictions

I got an email from Cliff DeJong this morning. Cliff is the creator of our exclusive AccuPredict weekly NASCAR Driver finish position predictor algorithm. He has worked with statistics his whole life and each off-season he pours back over the NASCAR numbers to learn how his computations can be modified to increase their accuracy. Cliff is and has been a great asset for me and all the subscribers at Fantasy Racing Cheat Sheet that use his AccuPredict data each week to help pick their weekly fantasy NASCAR drivers.

CLIFF HAS BEEN HARD AT WORK AGAIN

During this off-season Cliff examined the 2010 – 2013 NASCAR seasons and projected what he thinks will be the statistically likely finishes for the 2014 NASCAR season.

He used 2010 – 2012 to predict 2013, and then the same methodology with 2011-2013 data to predict 2014. As an interesting side-project he also looked at the last 10 years of notable rookies to estimate how Ricky Stenhouse Jr and Danica Patrick will do this year. As well as how well the rookies in general will do.

He is pretty happy with his results. Those of you that are really geeky into stats will get how exciting it is to have correlations of 0.88+. That is what Cliff was able to accomplish in this study.

ANY SURPRISES?

You bet.

Kevin Harvick is projecting to be the best average finisher in 2014. Matt Kenseth is second, and Jimmie Johnson will fall to third. Carl Edwards is in fourth, and Kyle Busch is just behind Carl in fifth. Cliff still is uncertain about how to predict who will be in the Chase with the new format, but right now he is comfortable to pick the top-twelve on his list almost for sure to be in.

Cliff shared that the major unknowns are how well Denny Hamlin and Tony Stewart will bounce back after their respective injuries. Plus, he notes the performance of rookies Austin Dillon and Parker Kligerman are also only rough estimates. For all the #3 fans he says the Austin Dillon in particular could do much better than the forecast shows.

ON TO THE RESULTS

Without further ado, here is Cliff’s predictions for the 2014 NASCAR season.

Rank Driver Average Finish
1 Kevin Harvick 10.9
2 Matt Kenseth 11.4
3 Jimmie Johnson 11.7
4 Carl Edwards 12.3
5 Kyle Busch 12.4
6 Brad Keselowski 12.7
7 Clint Bowyer 13.1
8 Dale  Earnhardt Jr 13.4
9 Jeff Gordon 13.7
10 Tony Stewart 13.9
11 Kasey Kahne 14.1
12 Greg Biffle 14.3
13 Martin Truex Jr 15.1
14 Joey Logano 15.3
15 Ryan Newman 15.4
16 Kurt Busch 15.7
17 Paul Menard 17.0
18 Denny Hamlin 17.3
19 Ricky Stenhouse Jr 17.7
20 Brian Vickers 18.3
21 Marcos Ambrose 18.7
22 Jamie McMurray 18.8
23 AJ Allmendinger 19.3
24 Austin Dillon 19.6
25 Parker  Kligerman 22.7
26 Danica Patrick 24.3
27 David Ragan 24.8
28 Casey Mears 25.7
29 Kyle Larson 26.7
30 David Gilliland 27.2
31 David Reutimann 27.4
32 Dave Blaney 29.4
33 Justin Allgaier 29.5
34 Travis Kvapil 29.6
35 Landon Cassill 30.0
36 David Stremme 32.8
37 JJ Yeley 33.6
38 Michael McDowell 37.3

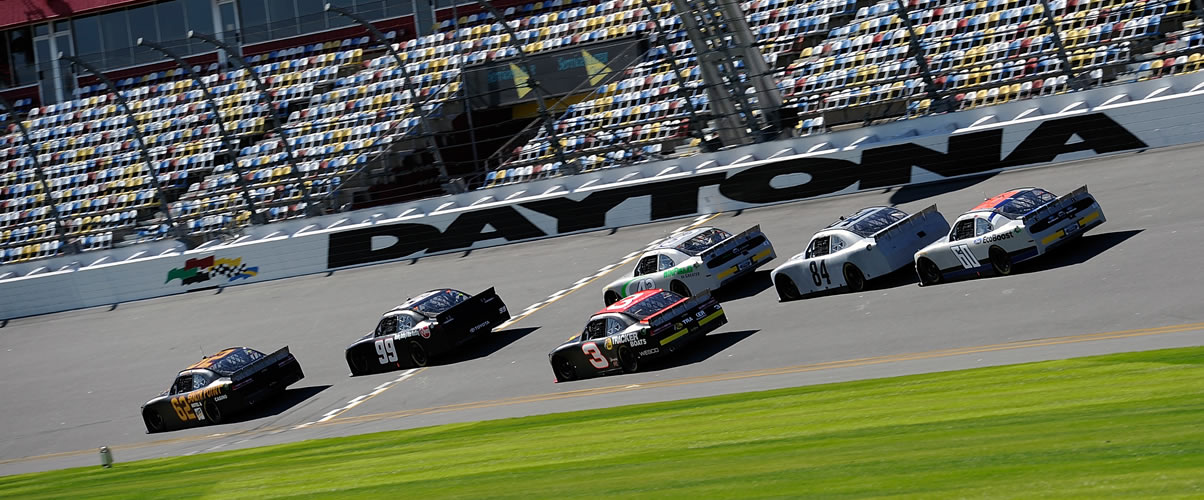
PHOTO CREDIT: NASCAR via Getty Images. PHOTO DESCRIPTION: Brendan Gaughan, driver of the #62 South Point Hotel & Casino Chevrolet, leads a pack of cars during NASCAR Preseason Thunder at Daytona International Speedway on January 12, 2014 in Daytona Beach, Florida.

Categories
By The Numbers

NASCAR 2013 GEN-6 RACE CAR IN REVIEW

NASCAR invested over two years of development, wind tunnel and on-track testing to bring the biggest change in NASCAR since 2007 when the “Car of Tomorrow” (aka COT) was introduced. NASCAR’s Generation-6 (GEN-6) car rolled out on to the track in Daytona at the start of the 2013 NASCAR season and now has its first season under its belt.

The intent was that the GEN-6 car would continue to bring more competition to the races and move closer to identifying the manufacturers brand than the cars have in many years.

BY THE NUMBERS

Here is a look at some of the interesting numbers tallied looking back at a full NASCAR season of data.

[separator type=’transparent’ normal_full_width=” pattern_full_width=” color=” thickness=’20’ up=’15’ down=’15’]

[two_col_50_50_col1]
[counter type=’type1′ position=’center’ delay=’500′ digit=’127306′ font_size=” font_color=’#E91B23′]

GREEN FLAG PASSES

The second highest total since the inception of Loop Data in 2005 – and 17,398 more passes than 2012.

[/counter]
[/two_col_50_50_col1]
[two_col_50_50_col2]
[counter type=’type1′ position=’center’ delay=’500′ digit=’971′ font_size=” font_color=’#E91B23′]

GREEN FLAG PASSES FOR THE LEAD

An increase from the 946 Green Flag Passes for the Lead in 2012.

[/counter]
[/two_col_50_50_col2]

[separator type=’transparent’ normal_full_width=” pattern_full_width=” color=” thickness=’30’ up=’15’ down=’15’]

[pie_chart type=’normal’ delay=’500′ title=’RUNNING AT FINISH’ percent=’83’ percentage_color=’#E91B23′ active_color=’#E91B23′ noactive_color=’#F1F1F1′] Percentage of cars that were running at the finish of races, up from 74.7% in 2012. [/pie_chart]

[pie_chart type=’normal’ delay=’500′ title=’FINISH ON LEAD LAP’ percent=’51’ percentage_color=’#E91B23′ active_color=’#E91B23′ noactive_color=’#F1F1F1′] Percentage of cars that finished on the lead lap, the highest percentage since 2009. [/pie_chart]

[pie_chart type=’normal’ delay=’500′ title=’MARGIN OF VICTORY UNDER 1-SECOND’ percent=’56’ percentage_color=’#E91B23′ active_color=’#E91B23′ noactive_color=’#F1F1F1′] Percentage of races that ended with a margin of victory under one second, up from 47% of races in the 2012 NASCAR season. [/pie_chart]

[separator type=’transparent’ normal_full_width=” pattern_full_width=” color=” thickness=” up=’25’ down=’10’]

[counter type=’type1′ position=’center’ delay=’500′ digit=’19’ font_size=” font_color=’#E91B23′]

TRACK QUALIFYING RECORDS BROKEN

[/counter]

[counter type=’type1′ position=’center’ delay=’500′ digit=’5′ font_size=” font_color=’#E91B23′]

RACES WITH RECORD PASSES FOR THE LEAD

[/counter]

[counter type=’type1′ position=’center’ delay=’500′ digit=’10’ font_size=” font_color=’#E91B23′]

AVERAGE NUMBER OF LEADERS PER RACE

[/counter]