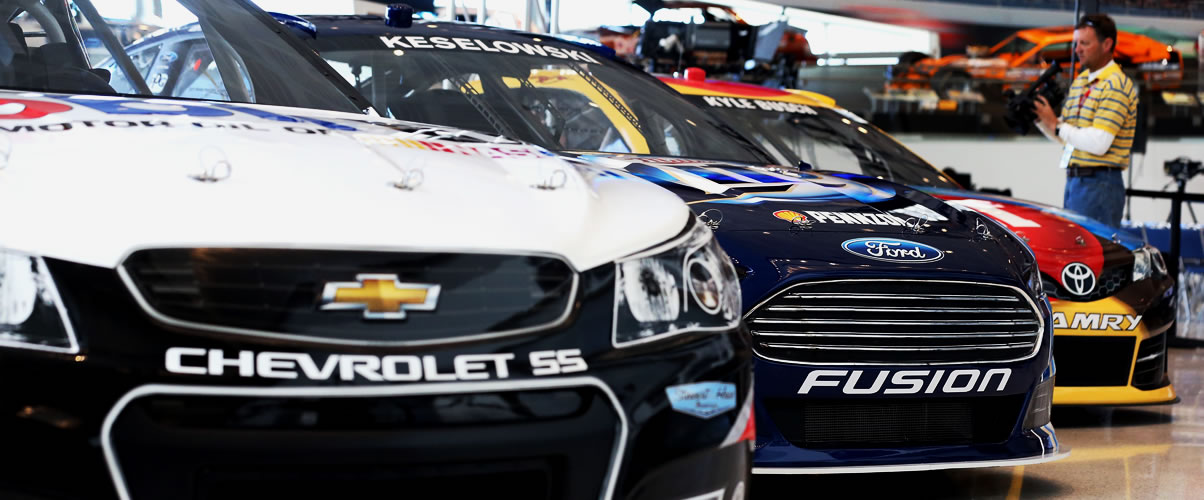
NASCAR invested over two years of development, wind tunnel and on-track testing to bring the biggest change in NASCAR since 2007 when the “Car of Tomorrow” (aka COT) was introduced. NASCAR’s Generation-6 (GEN-6) car rolled out on to the track in Daytona at the start of the 2013 NASCAR season and now has its first season under its belt.
The intent was that the GEN-6 car would continue to bring more competition to the races and move closer to identifying the manufacturers brand than the cars have in many years.
BY THE NUMBERS
Here is a look at some of the interesting numbers tallied looking back at a full NASCAR season of data.
[separator type=’transparent’ normal_full_width=” pattern_full_width=” color=” thickness=’20’ up=’15’ down=’15’]
[two_col_50_50_col1]
[counter type=’type1′ position=’center’ delay=’500′ digit=’127306′ font_size=” font_color=’#E91B23′]
GREEN FLAG PASSES
The second highest total since the inception of Loop Data in 2005 – and 17,398 more passes than 2012.
[/counter]
[/two_col_50_50_col1]
[two_col_50_50_col2]
[counter type=’type1′ position=’center’ delay=’500′ digit=’971′ font_size=” font_color=’#E91B23′]
GREEN FLAG PASSES FOR THE LEAD
An increase from the 946 Green Flag Passes for the Lead in 2012.
[/counter]
[/two_col_50_50_col2]
[separator type=’transparent’ normal_full_width=” pattern_full_width=” color=” thickness=’30’ up=’15’ down=’15’]
[pie_chart type=’normal’ delay=’500′ title=’RUNNING AT FINISH’ percent=’83’ percentage_color=’#E91B23′ active_color=’#E91B23′ noactive_color=’#F1F1F1′] Percentage of cars that were running at the finish of races, up from 74.7% in 2012. [/pie_chart]
[pie_chart type=’normal’ delay=’500′ title=’FINISH ON LEAD LAP’ percent=’51’ percentage_color=’#E91B23′ active_color=’#E91B23′ noactive_color=’#F1F1F1′] Percentage of cars that finished on the lead lap, the highest percentage since 2009. [/pie_chart]
[pie_chart type=’normal’ delay=’500′ title=’MARGIN OF VICTORY UNDER 1-SECOND’ percent=’56’ percentage_color=’#E91B23′ active_color=’#E91B23′ noactive_color=’#F1F1F1′] Percentage of races that ended with a margin of victory under one second, up from 47% of races in the 2012 NASCAR season. [/pie_chart]
[separator type=’transparent’ normal_full_width=” pattern_full_width=” color=” thickness=” up=’25’ down=’10’]
[counter type=’type1′ position=’center’ delay=’500′ digit=’19’ font_size=” font_color=’#E91B23′]
TRACK QUALIFYING RECORDS BROKEN
[/counter]
[counter type=’type1′ position=’center’ delay=’500′ digit=’5′ font_size=” font_color=’#E91B23′]
RACES WITH RECORD PASSES FOR THE LEAD
[/counter]
[counter type=’type1′ position=’center’ delay=’500′ digit=’10’ font_size=” font_color=’#E91B23′]
AVERAGE NUMBER OF LEADERS PER RACE
[/counter]