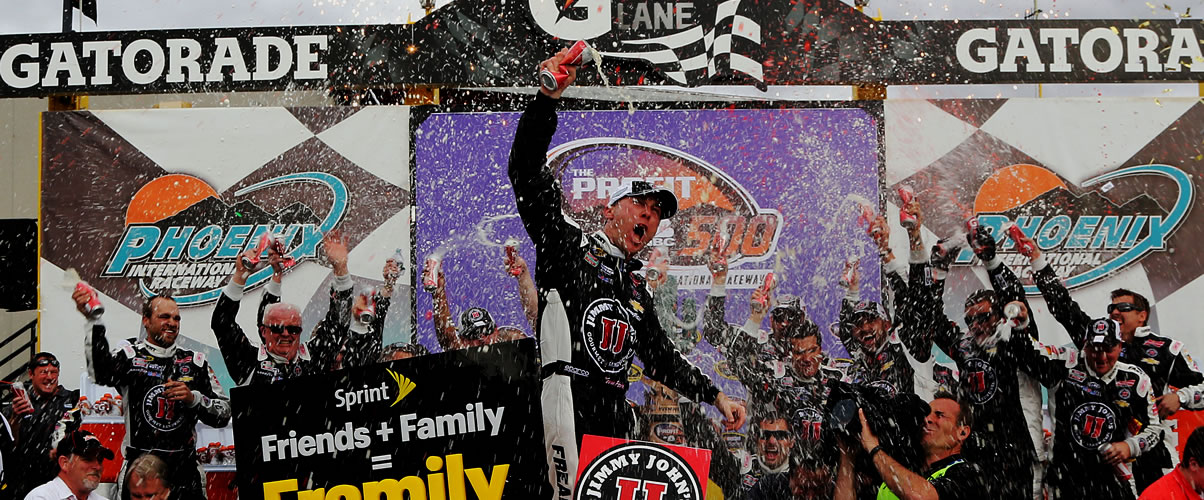
The new NASCAR Chase Grid format for 2014 will have 16 drivers – the points leader and 15 top-30 drivers who have won races. Since the top drivers will almost certainly have multiple race wins, it seems that winning a single race could be a ticket to the NASCAR Chase.
ESTIMATING WIN PROBABILITIES
With that in mind, I sought to estimate each driver’s probability of winning a race. To do that, I looked at the 2011 – 2013 NASCAR seasons and counted up each driver’s number of wins and their total number of races. For example, Matt Kenseth won 13 out of 108 races, which gives an estimate of Matt’s winning percentage as 12%. Jimmie Johnson also won 13 of 108, and Tony Stewart won 9 of 92 for a percentage of 9.8%. Of course, several drivers did not win at all and we will deal with that later.
The winning percentage of a driver can be used as an estimate of a driver’s probability of winning for each race. With 26 races before the Chase, if the probability of winning each race is 10%, then the probability of winning at least one race is one minus the probability of losing each race, which is (1-10%)^26, or about 2%. This means that the likelihood of winning at least one race (and presumably getting in the chase) for this example is 94%.
WIN PROBABILITIES (TWO RACES IN)
Shown below are the probabilities of winning at least one race before the Chase, based on the frequency of wins in 2011-2013, updated after the Daytona and Phoenix races, won by Dale Earnhardt Jr., and Kevin Harvick. The chart only shows race winners during those years, excluding Trevor Bayne, who is not eligible for points in the Cup Series.
[progress_bars type=’normal’]
[progress_bar title=”Kevin Harvick” percent=”100″ color=’#262626′ background_color=” noactive_background_color=” top_gradient=” bottom_gradient=”]
[progress_bar title=”Dale Earnhardt Jr” percent=”100″ color=’#262626′ background_color=’#262626′ noactive_background_color=” top_gradient=” bottom_gradient=”]
[progress_bar title=”Jimmie Johnson” percent=”95″ color=’#262626′ background_color=” noactive_background_color=” top_gradient=” bottom_gradient=”]
[progress_bar title=”Matt Kenseth” percent=”95″ color=’#262626′ background_color=’#262626′ noactive_background_color=” top_gradient=” bottom_gradient=”]
[progress_bar title=”Tony Stewart” percent=”92″ color=’#262626′ background_color=” noactive_background_color=” top_gradient=” bottom_gradient=”]
[progress_bar title=”Brad Keselowski” percent=”88″ color=’#262626′ background_color=’#262626′ noactive_background_color=” top_gradient=” bottom_gradient=”]
[progress_bar title=”Kyle Busch” percent=”88″ color=’#262626′ background_color=” noactive_background_color=” top_gradient=” bottom_gradient=”]
[progress_bar title=”Denny Hamlin” percent=”82″ color=’#262626′ background_color=’#262626′ noactive_background_color=” top_gradient=” bottom_gradient=”]
[progress_bar title=”Jeff Gordon” percent=”75″ color=’#262626′ background_color=” noactive_background_color=” top_gradient=” bottom_gradient=”]
[progress_bar title=”Kasey Kahne” percent=”68″ color=’#262626′ background_color=’#262626′ noactive_background_color=” top_gradient=” bottom_gradient=”]
[progress_bar title=”Clint Bowyer” percent=”60″ color=’#262626′ background_color=” noactive_background_color=” top_gradient=” bottom_gradient=”]
[progress_bar title=”Carl Edwards” percent=”49″ color=’#262626′ background_color=’#262626′ noactive_background_color=” top_gradient=” bottom_gradient=”]
[progress_bar title=”Greg Biffle” percent=”49″ color=’#262626′ background_color=” noactive_background_color=” top_gradient=” bottom_gradient=”]
[progress_bar title=”Kurt Busch” percent=”36″ color=’#262626′ background_color=’#262626′ noactive_background_color=” top_gradient=” bottom_gradient=”]
[progress_bar title=”David Ragan” percent=”36″ color=’#262626′ background_color=” noactive_background_color=” top_gradient=” bottom_gradient=”]
[progress_bar title=”Marcos Ambrose” percent=”36″ color=’#262626′ background_color=’#262626′ noactive_background_color=” top_gradient=” bottom_gradient=”]
[progress_bar title=”Joey Logano” percent=”36″ color=’#262626′ background_color=” noactive_background_color=” top_gradient=” bottom_gradient=”]
[progress_bar title=”Brian Vickers” percent=”33″ color=’#262626′ background_color=’#262626′ noactive_background_color=” top_gradient=” bottom_gradient=”]
[progress_bar title=”Jamie McMurray” percent=”20″ color=’#262626′ background_color=” noactive_background_color=” top_gradient=” bottom_gradient=”]
[progress_bar title=”Paul Menard” percent=”20″ color=’#262626′ background_color=’#262626′ noactive_background_color=” top_gradient=” bottom_gradient=”]
[progress_bar title=”Ryan Newman” percent=”20″ color=’#262626′ background_color=” noactive_background_color=” top_gradient=” bottom_gradient=”]
[progress_bar title=”Martin Truex Jr” percent=”20″ color=’#262626′ background_color=’#262626′ noactive_background_color=” top_gradient=” bottom_gradient=”]
[/progress_bars]
Dale Earnhardt, Jr. and Kevin Harvick are shown as 100% likely to win in 2014 because they already have. Each week, this table would be updated by moving the race winners to 100% and decreasing the number of remaining races by one. Other than the winners, the driver probabilities of winning at least one race will not change very fast.
OVER 50% – UNDER 50%
Eleven drivers are shown as more likely to win one race or more than to not win any. It is not surprising that this method shows that several of the top drivers (from Matt Kenseth to Denny Hamlin) are very likely (but not certain) to win a spot in the Chase this year. Jeff Gordon is just under 80%, and Kasey Kahne is about 70%. Clint Bowyer is more likely than not to get in, and Greg Biffle and Carl Edwards are equally likely. But, the probability is under 50% for drivers from Kurt Busch on down through the single race winners during the last three years.
NO PREVIOUS WINS?
The results shown are based on the best estimates of each drivers winning probability, developed by dividing the number of wins by the number of races. So, what about those drivers that didn’t win in the last three years? The best estimate of their winning probability is 0%. In other words, they won’t win this year either, as a best estimate. But, some could win their first race, of course.
So, how can we estimate how likely that is? Since all drivers are nowhere near being equal, the non-winners probability is well less than 1/43, which is about 2%. Another way to look at this is to consider that if their true probability of winning was 0.6%, or 1 out of 167 races, then it is just as likely that they would win one or more races as to not win at all. So, all we can say is that it is likely that their true probability of winning is less than 0.6%. This translates into a probability of winning at least one race of the 24 remaining of 13%. The implication is that their win probability is not more than 13%. In most cases, it is much less than 13%.
